
Agent less K8S monitoring for Kubernetes
1. Go to the Kubernetes menu in the left side menu, click the Cluster IP to view the details.
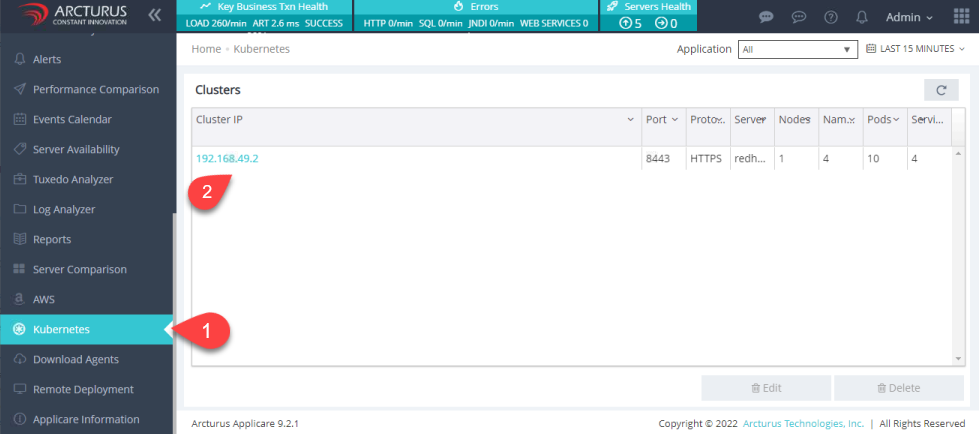
2. Here you get the Kubernetes Cluster Details.
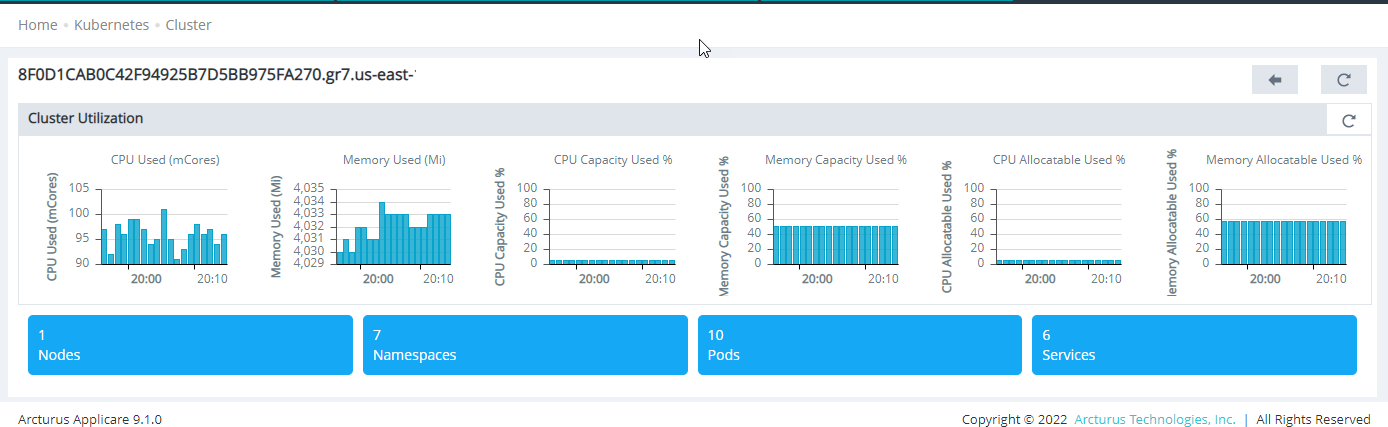
CPU Used -
Total CPU utilization across all nodes in the cluster, measured in milicores.
Memory Used -
Total memory utilization across all nodes in the cluster, measured in mebibytes (MiB).
- CPU Capacity Used % - Percentage of CPU utilized from its capacity value.
- Memory Capacity Used % - Percentage of memory utilized from its capacity value.
Allocatable - It indicates the amount of resources on a Node that is available to be consumed by normal Pods.
Capacity - Indicates the total amount of resources that a Node has
CPU Allocatable Used % - Percentage of CPU utilized from its allocatable value.
Memory Allocatable Used % - Percentage of memory utilized from its allocatable value.
3. Click the Nodes, Namespaces, Pods and Services to view the details.
Nodes
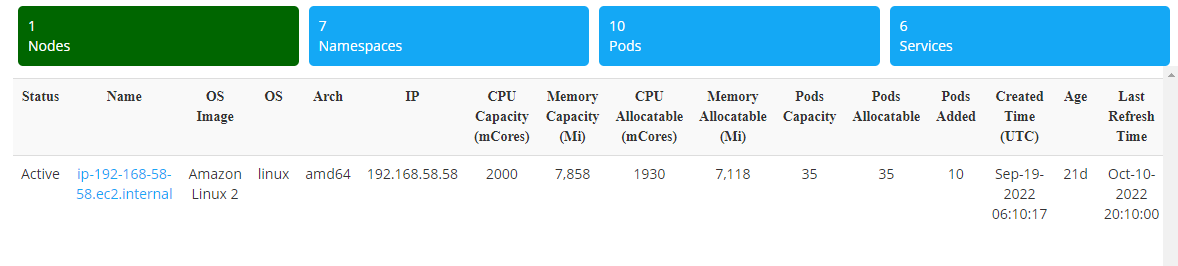
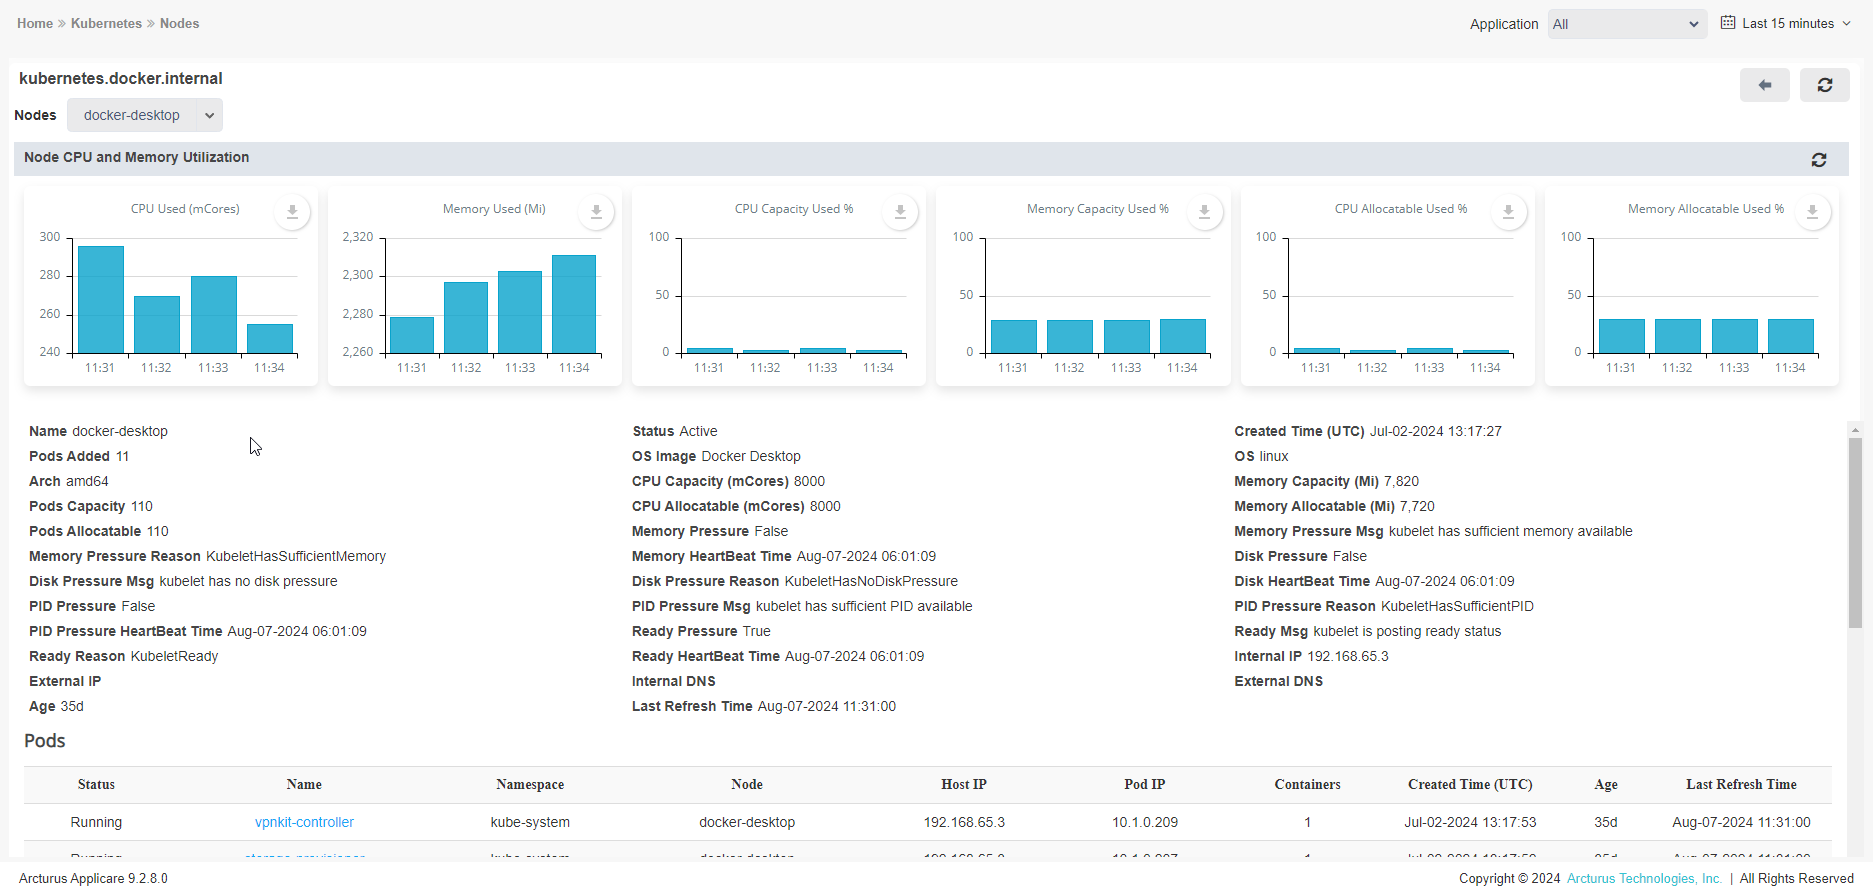
4. Click the Name column to view the node details.
CPU Used - Total CPU utilization for individual node in the cluster.
Memory Used - Total memory utilization for individual node in the cluster.
Namespaces
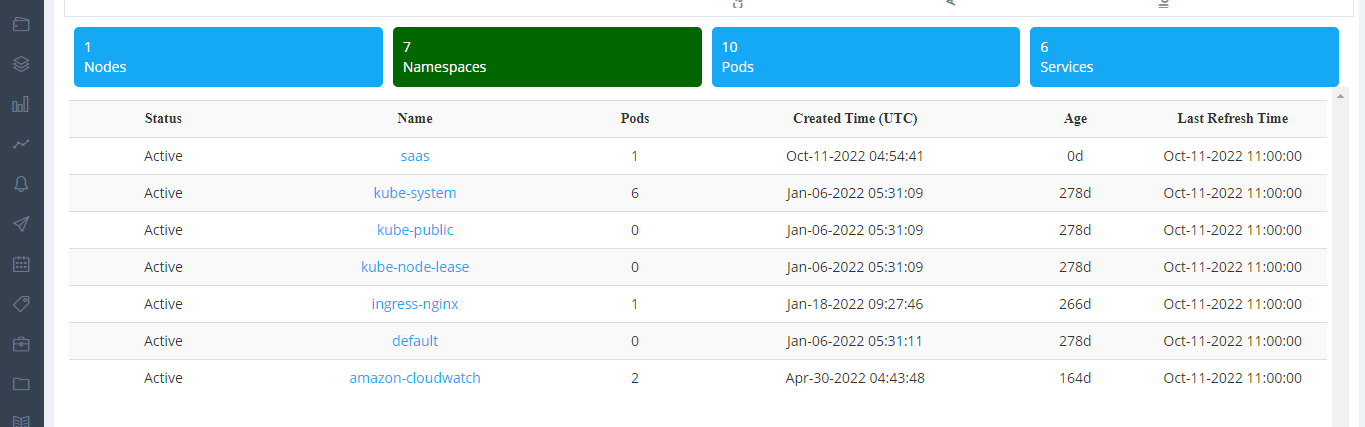
- Click the Name column to view the namespace details.
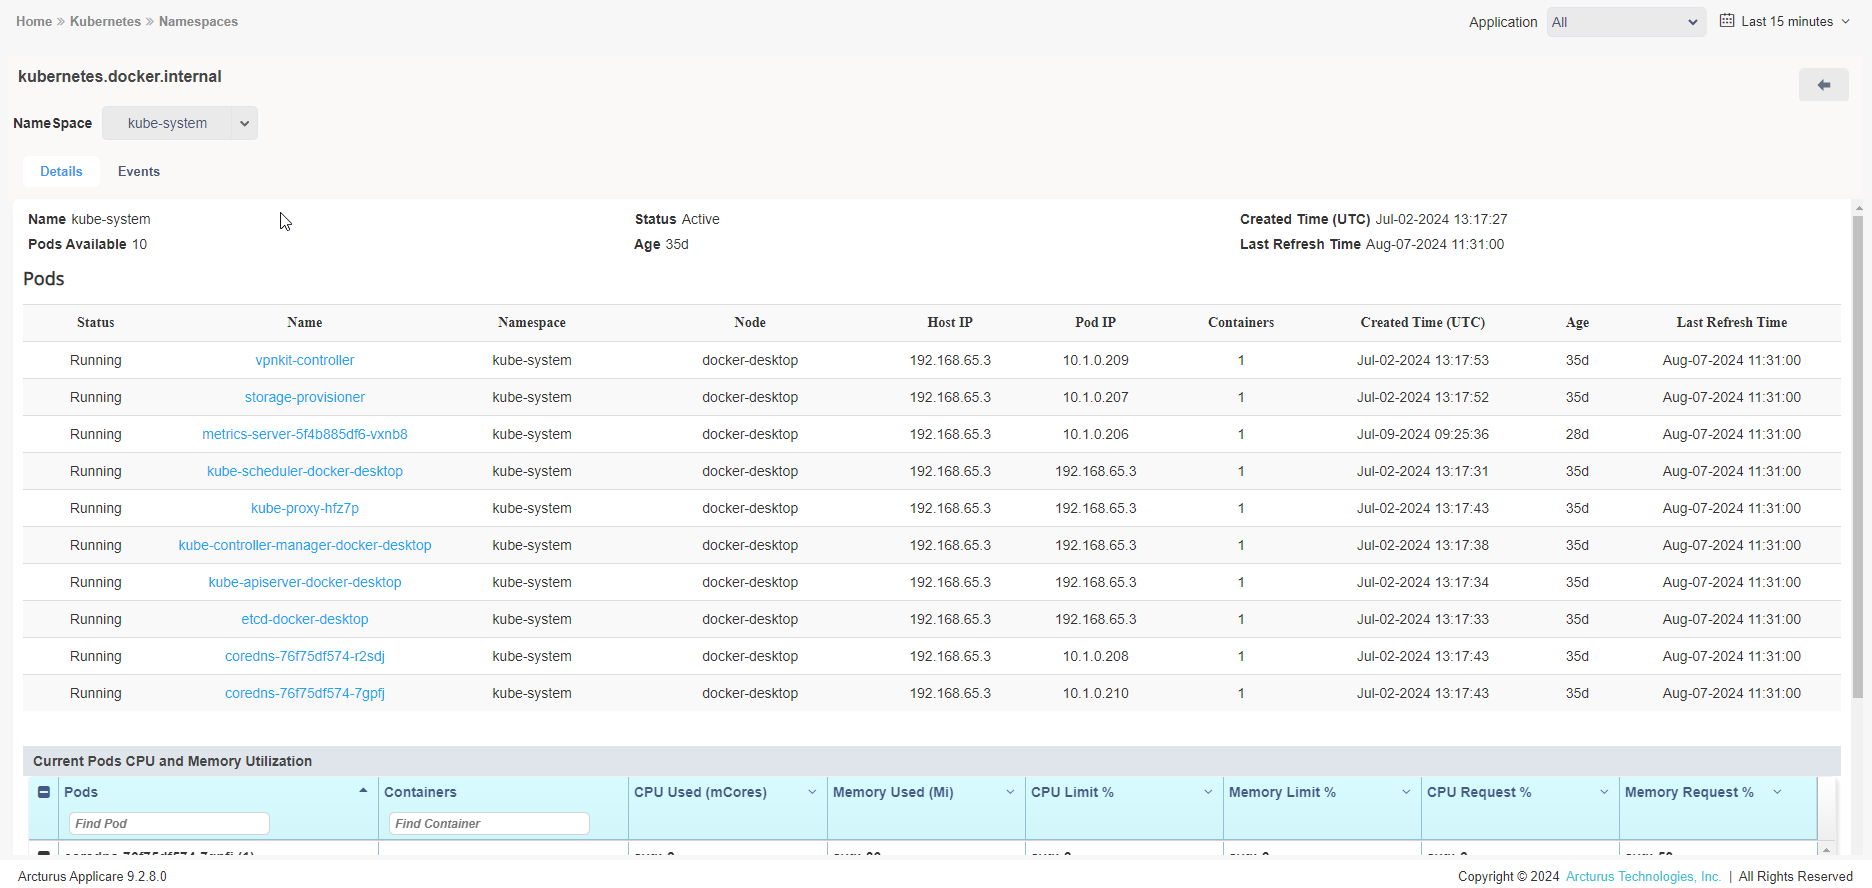
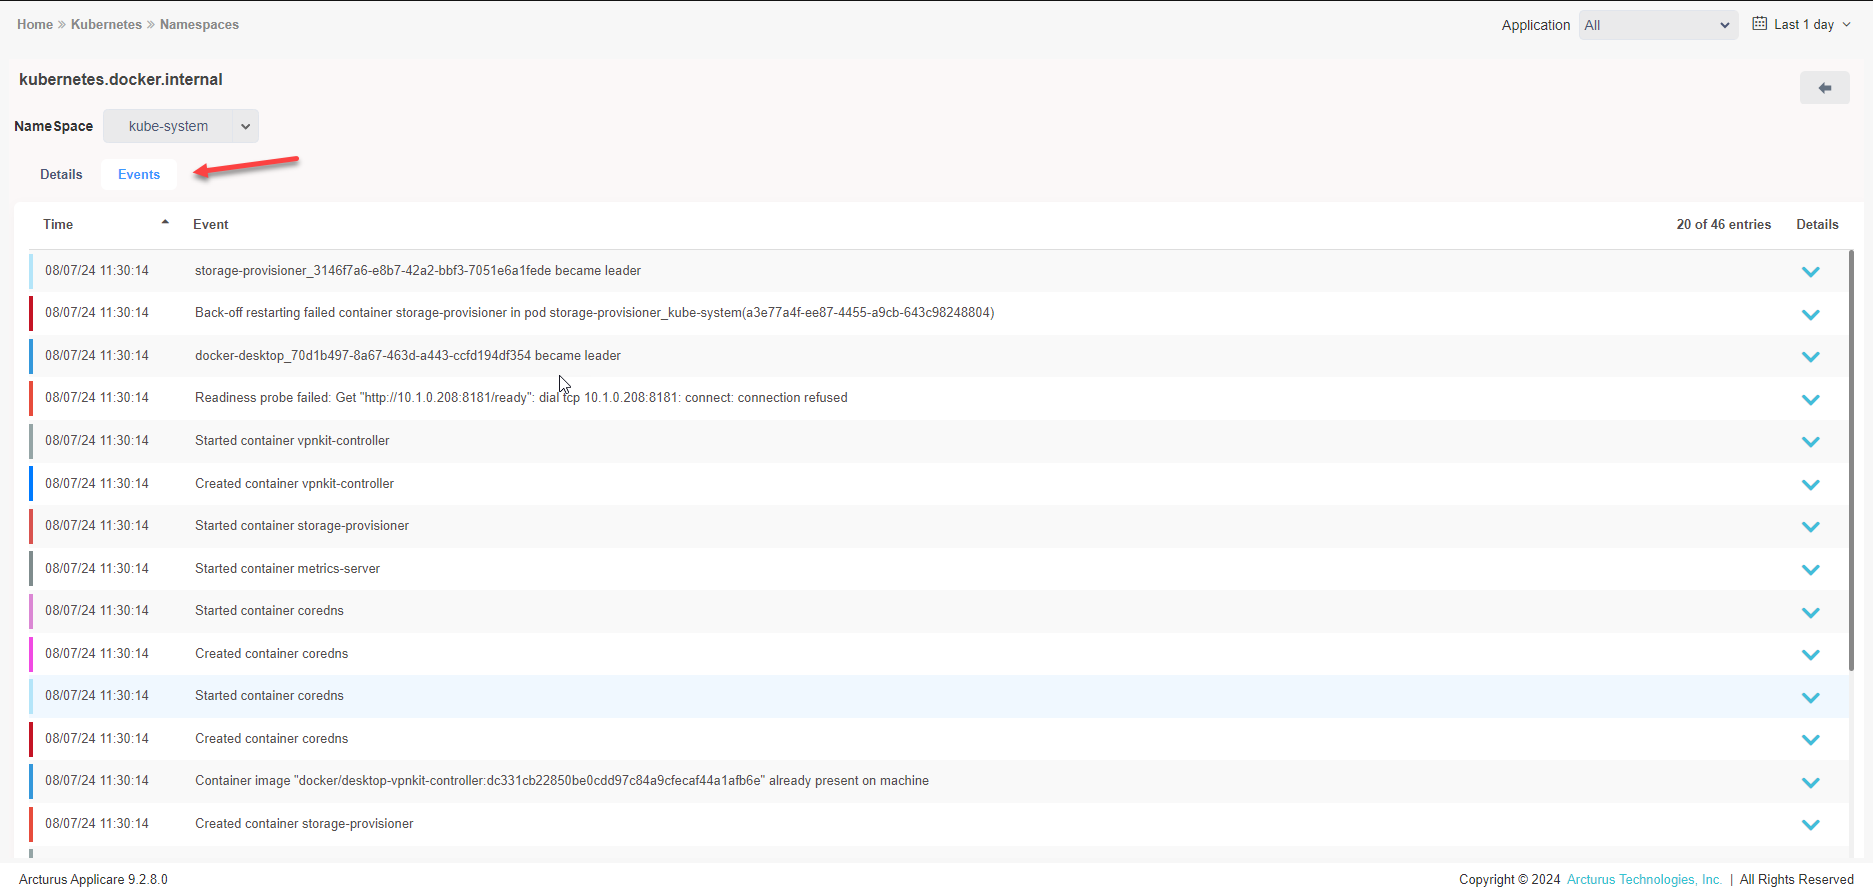
6. Click the Events tab to view the event details for the selected namespace.
Pods
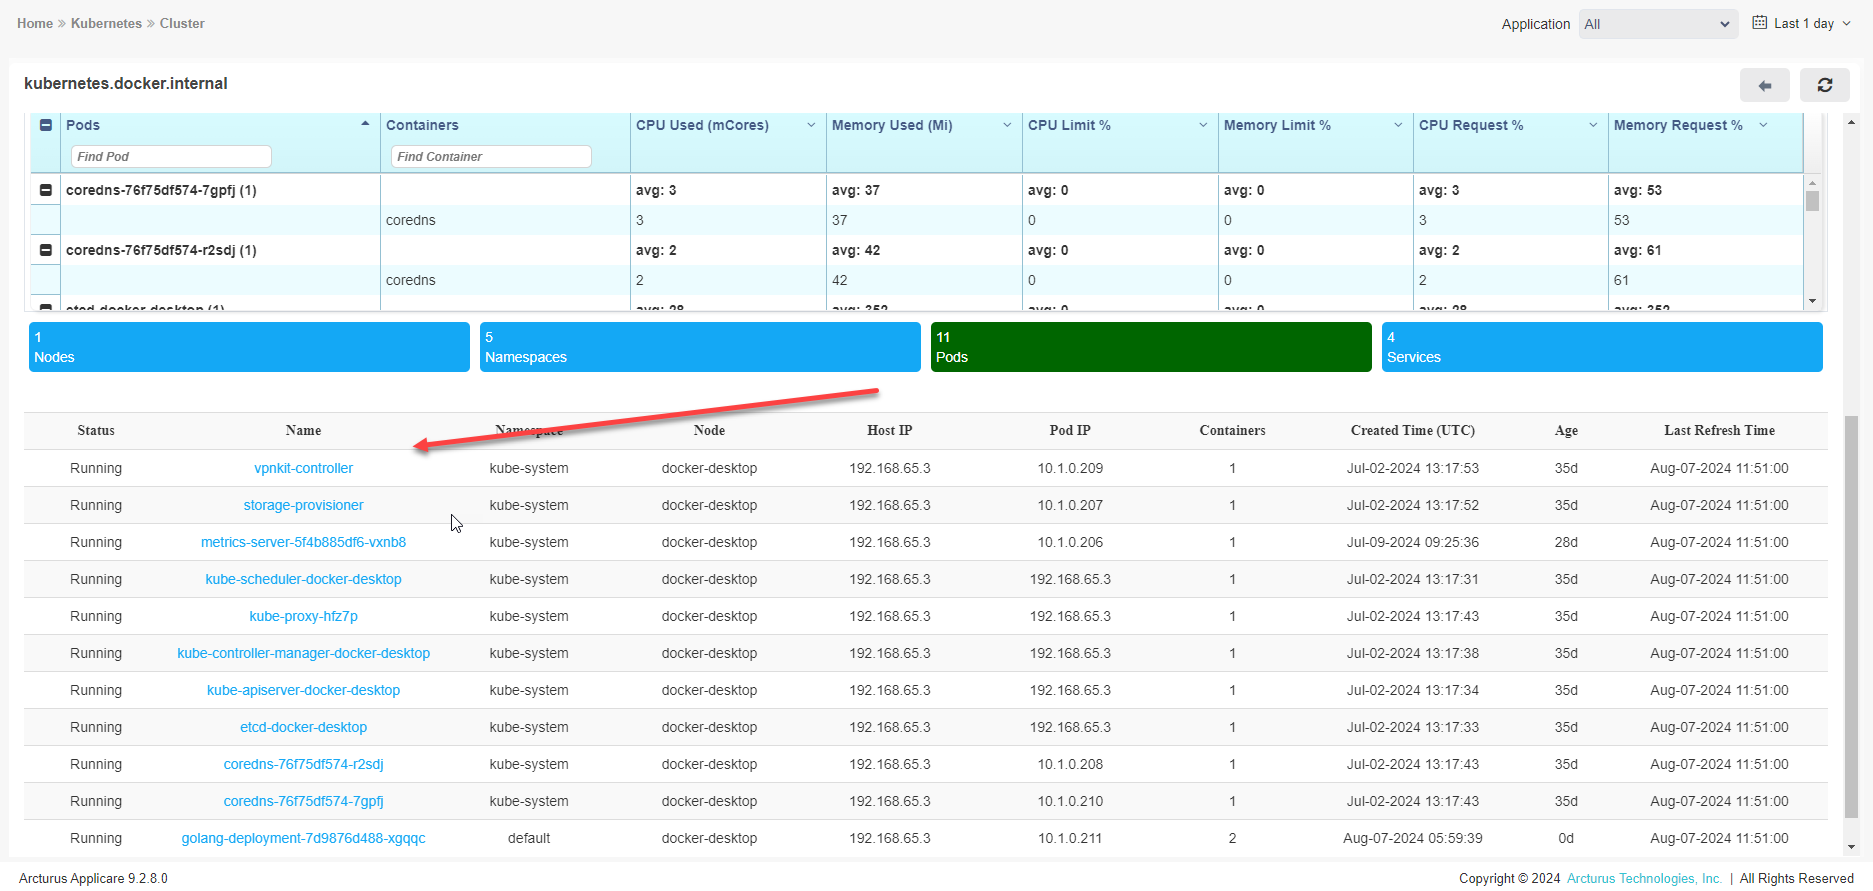
7. Click on the Pod in Name column to view the pod details.
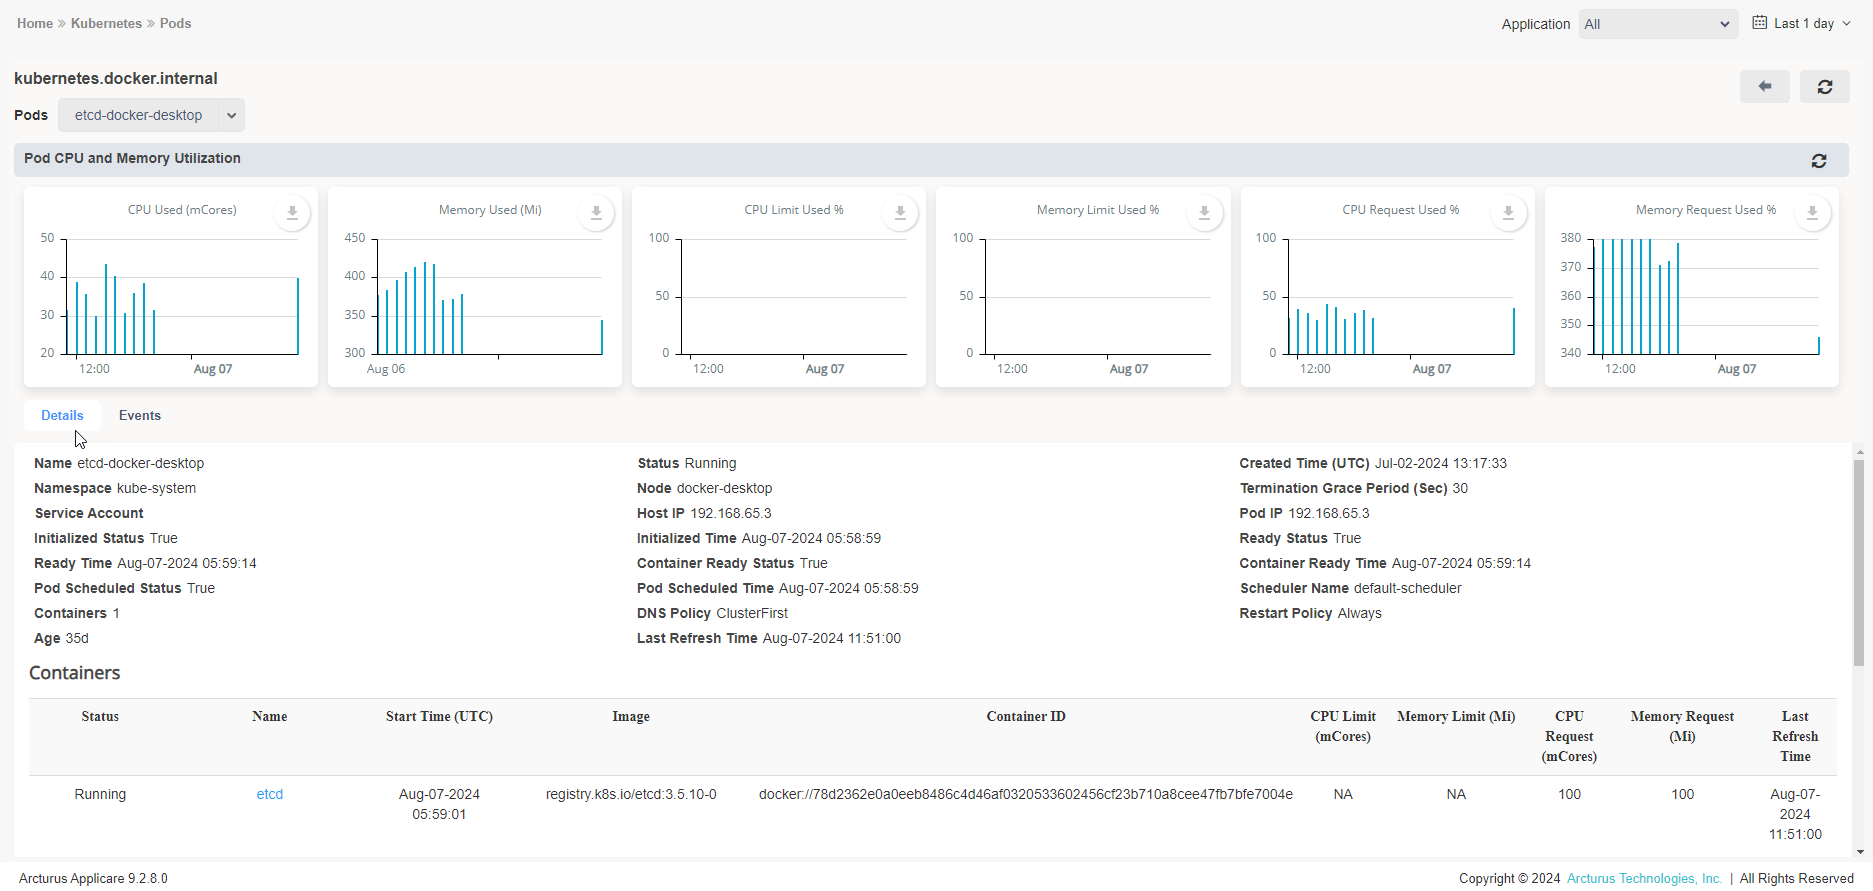
- CPU Used - Total CPU utilization of all the containers in the pods (milicores).
- Memory Used - Total memory utilization of all the containers in the pods (mebibytes).
- CPULimit - Defines a hard ceiling on how much CPU time that the container can use. During each scheduling interval (time slice), the Linux kernel checks to see if this limit is exceeded; if so, the kernel waits before allowing that cgroup to resume execution.
- Memory Limit - Defines a memory limit for that cgroup. If the container tries to allocate more memory than this limit, the Linux kernel out-of-memory subsystem activates and, typically, intervenes by stopping one of the processes in the container that tried to allocate memory. If that process is the container's PID 1, and the container is marked as restartable, Kubernetes restarts the container.
- CPU request - Typically defines a weighting. If several different containers (cgroups) want to run on a contended system, workloads with larger CPU requests are allocated more CPU time than workloads with small requests.
- Memory request - Mainly used during (Kubernetes) Pod scheduling.
- CPU Limit Used % - Percentage of CPU utilized from its cpu limit.
- Memory Limit Used % - Percentage of memory utilized from its memory limit.
- CPU Request Used % - Percentage of CPU utilized from its cpu request.
- Memory Request Used % - Percentage of memory utilized from its memory request.
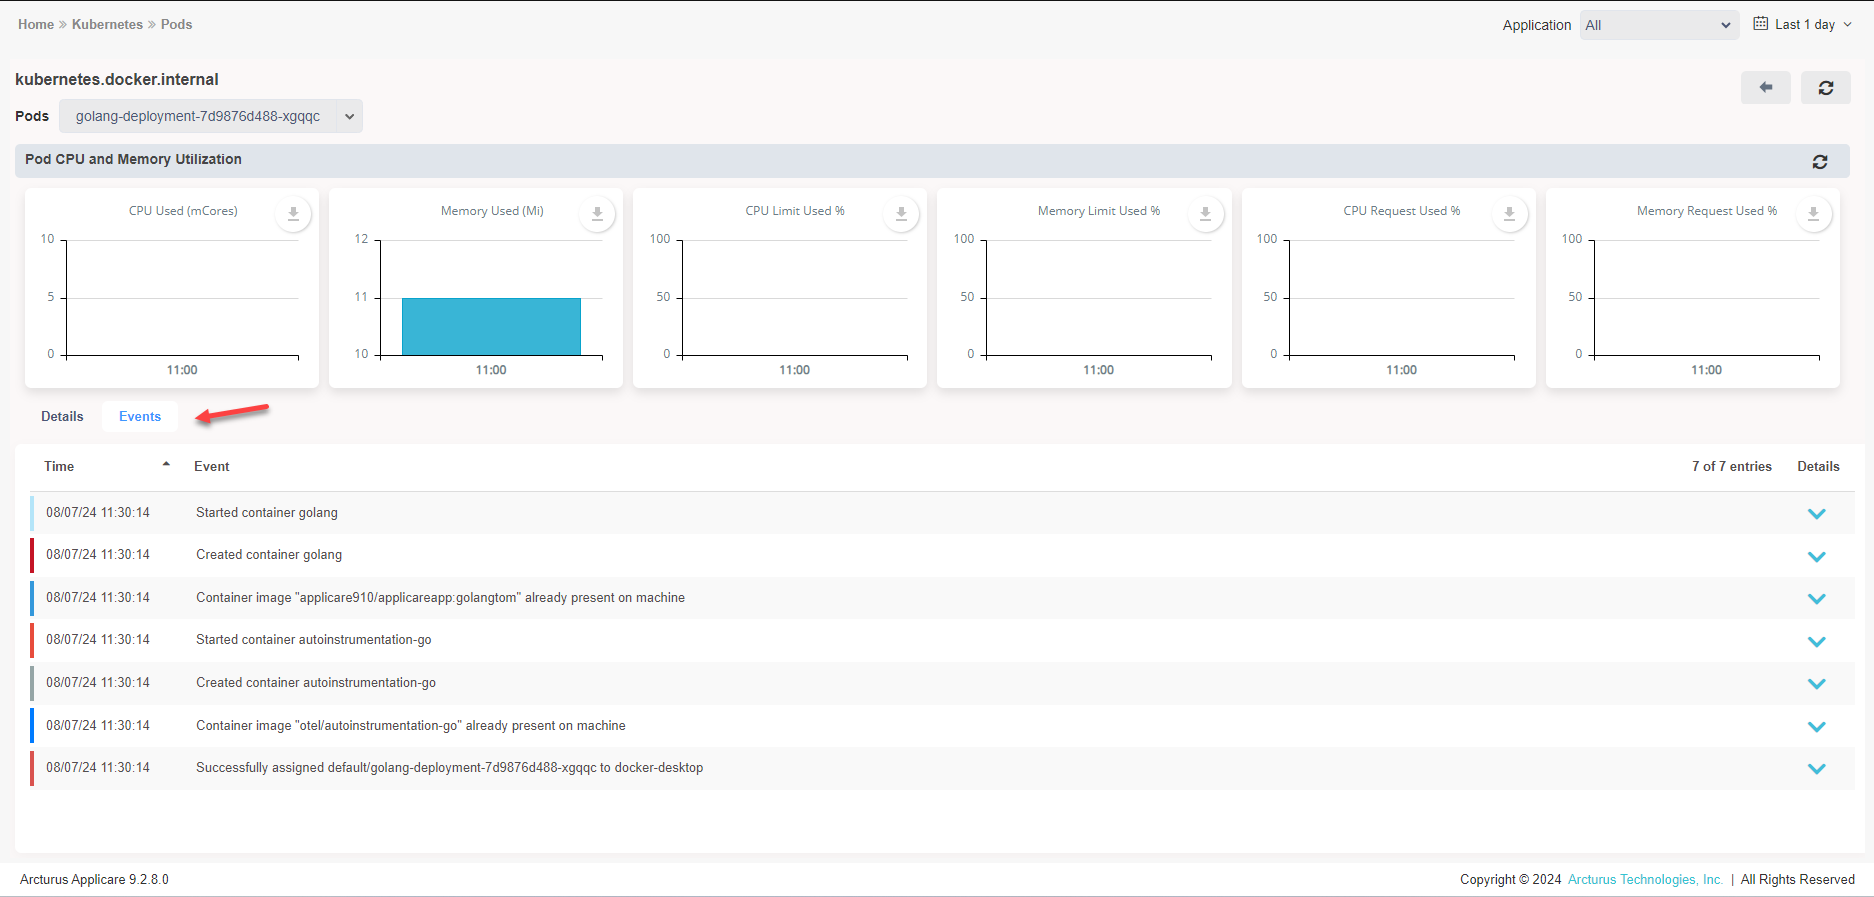
8. Click on the Events tab to view the pod event details.
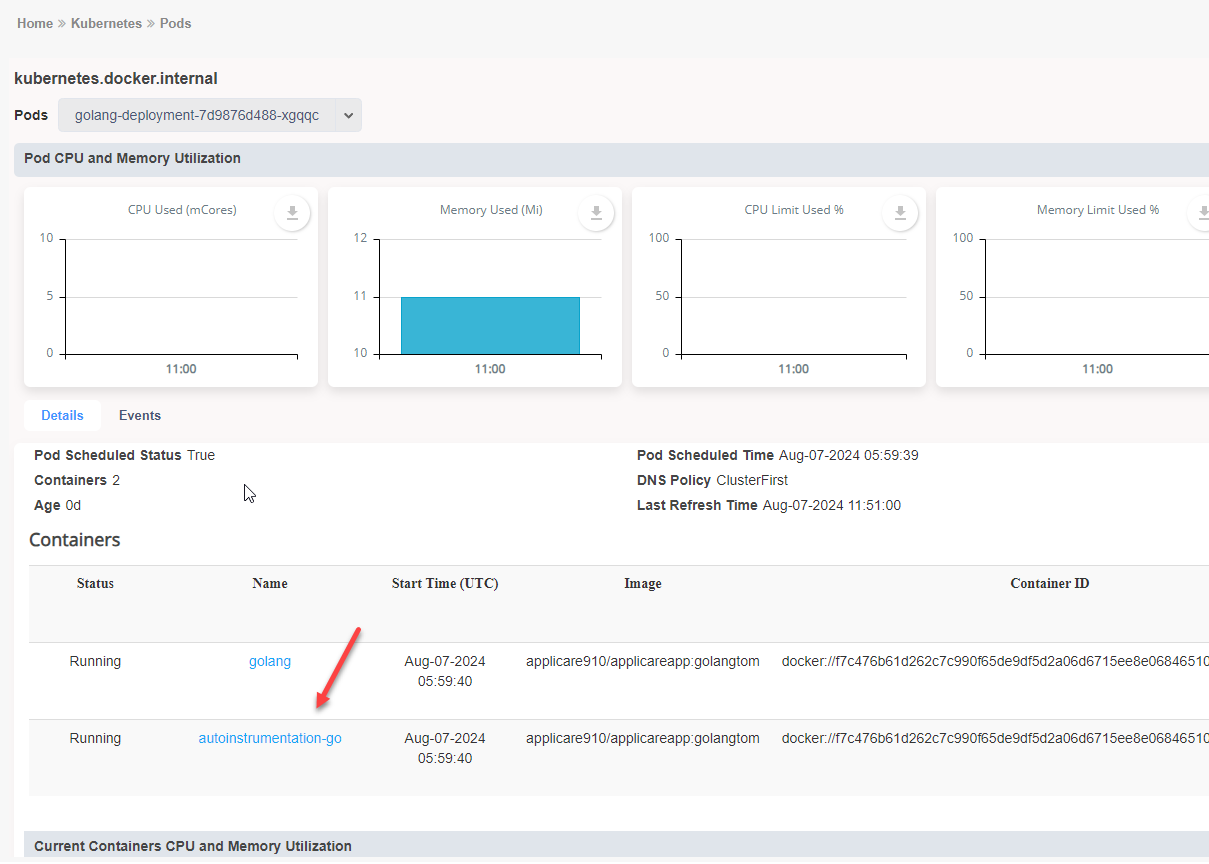
9. Click on the Container in the Name column to view the container details.
CPU Used - Total CPU utilization for each individual container in the pod.
Memory Used - Total memory utilization for each individual container in the pod.
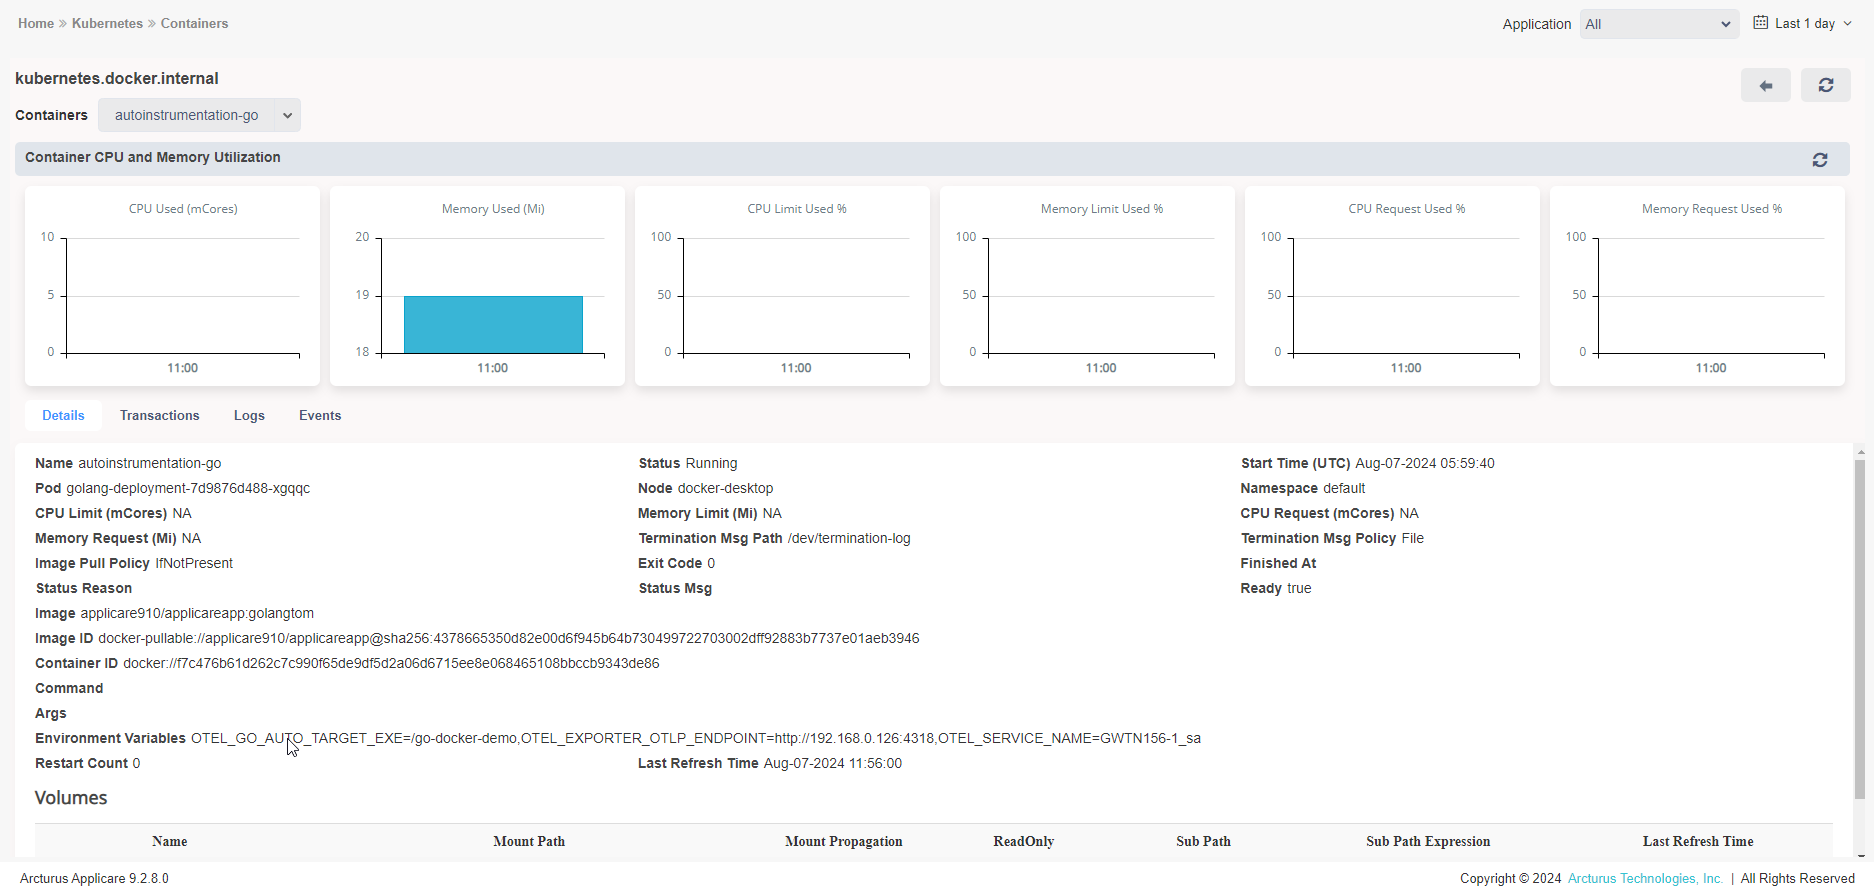
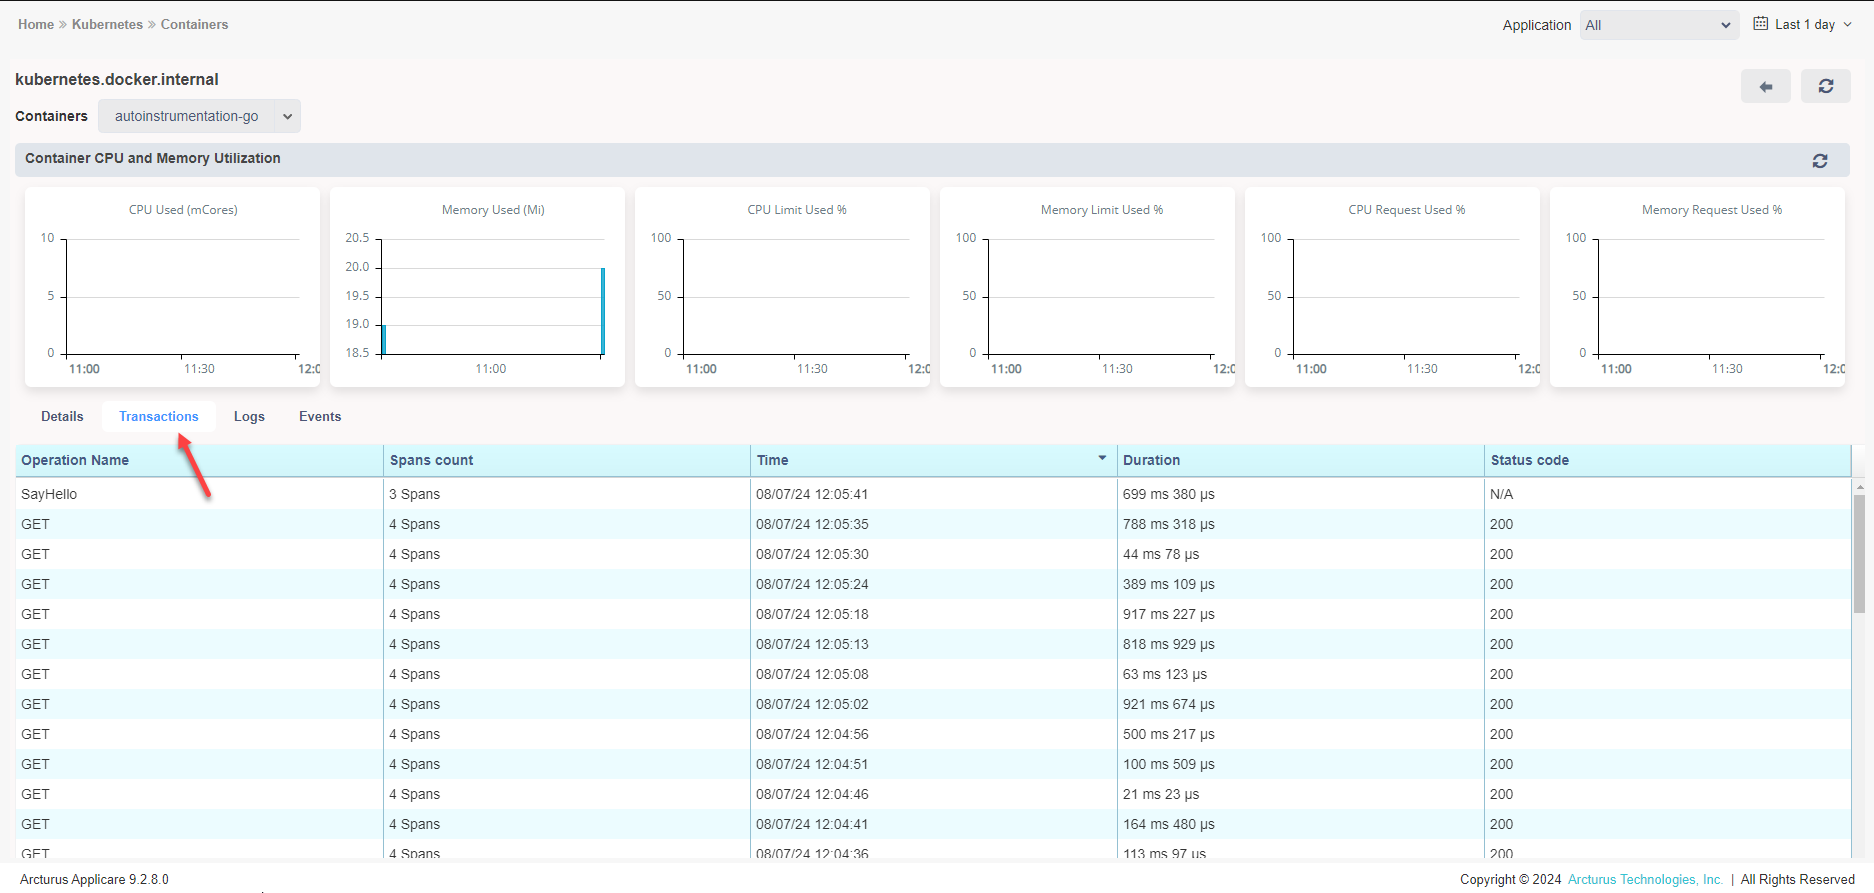
10. Click on the Transactions tab to view the Application transaction details.
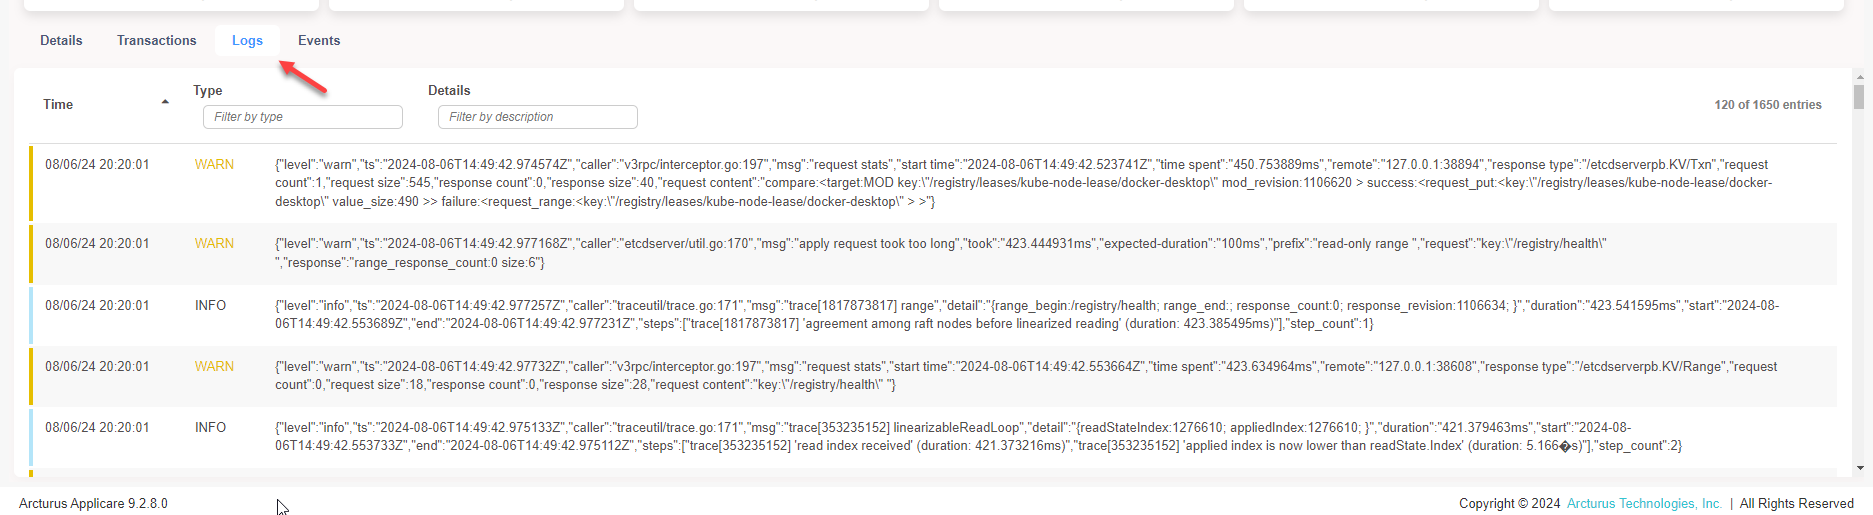
11. Click on the Logs tab to view the Container Log entries.
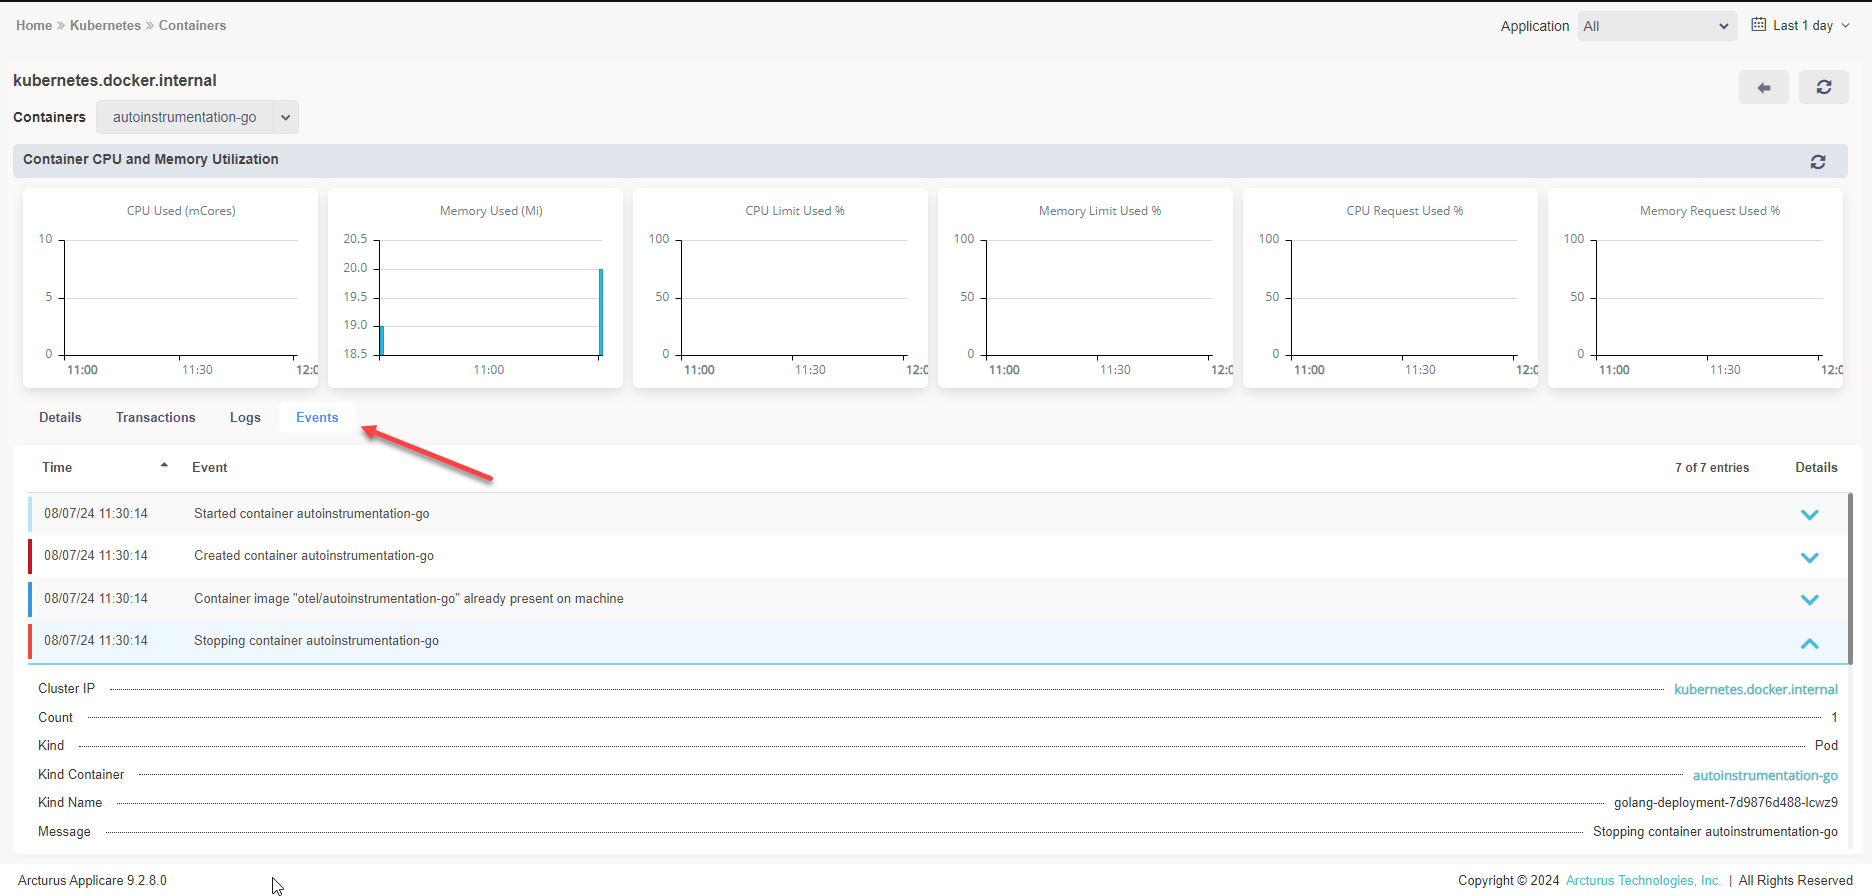
12. Click the Events tab to view the container event entries.
Services

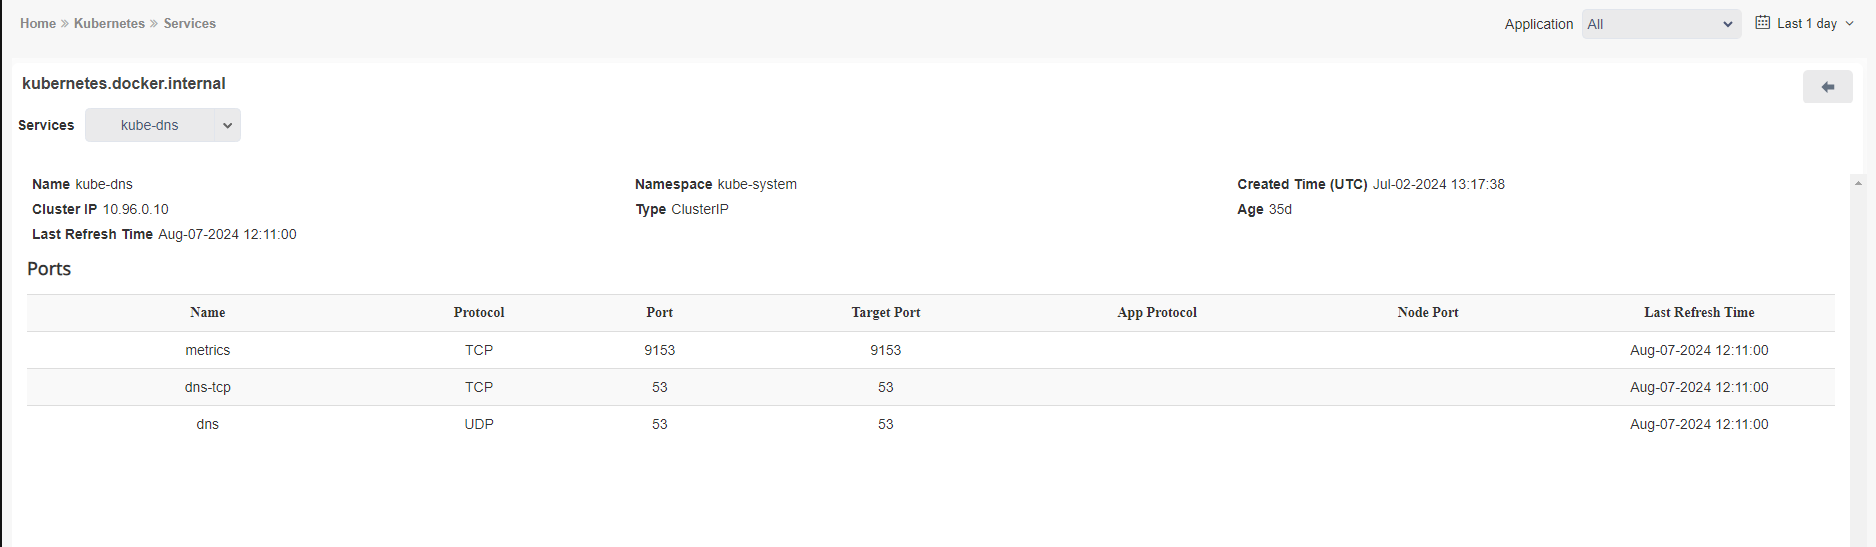
13. Click the Name column to view the details of the service.
Configuration
* Configuring Local Kubernetes Monitoring
* Configuring Remote Kubernetes Monitoring
You can use Applicare to assist with your Monitoring needs.