Log in to Applicare controller and navigate to the Server Analyzer menu to view the details.
Dashboard
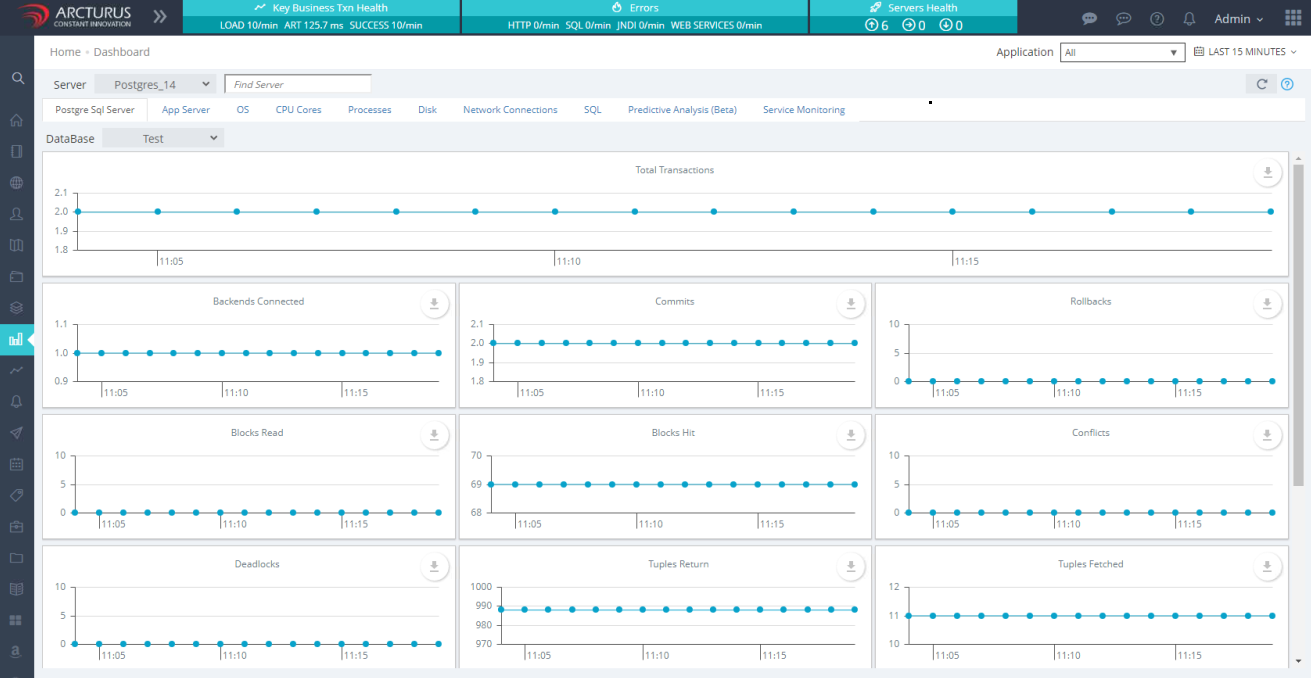
Database performance metrics assist in monitoring and optimize your database's performance in your business. The metrics are calculated for the entire server, not limited to the database specified in the JDBC URL.
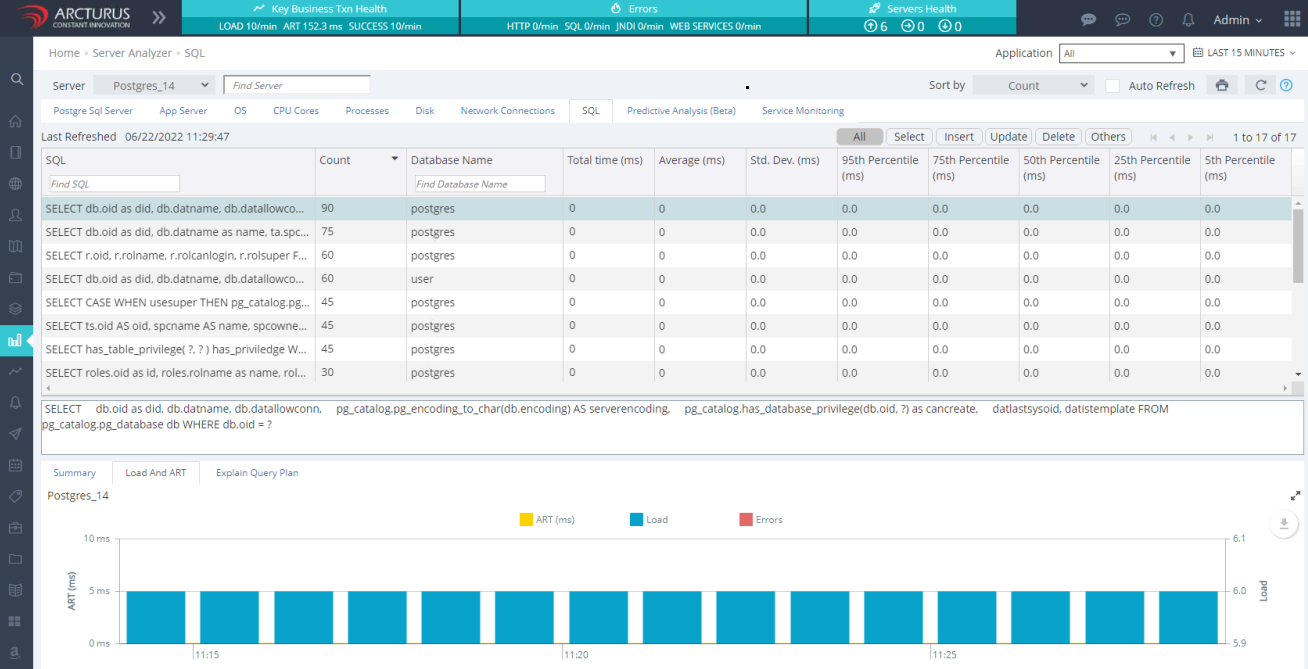
SQL
SQL Statement Profiling provides the performance statistics of database queries. It helps you identify which statements are the most time and quickly diagnose performance issues SQL/s. Additionally, It provides detailed stats, including information on the database, query count, average execution time and various percentiles.
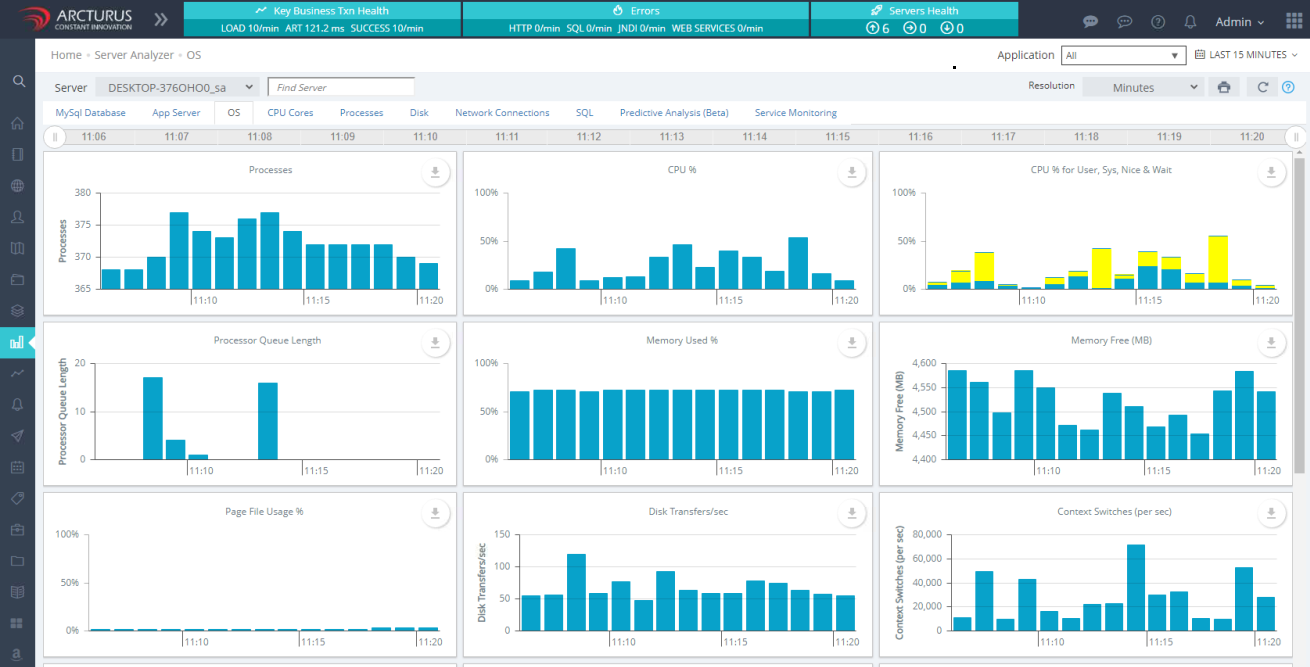
OS
This view offers a quick and convenient overview of your physical server's/VM's performance including details on the number of processes, context switches, CPU Usage, memory, storage performance and more.
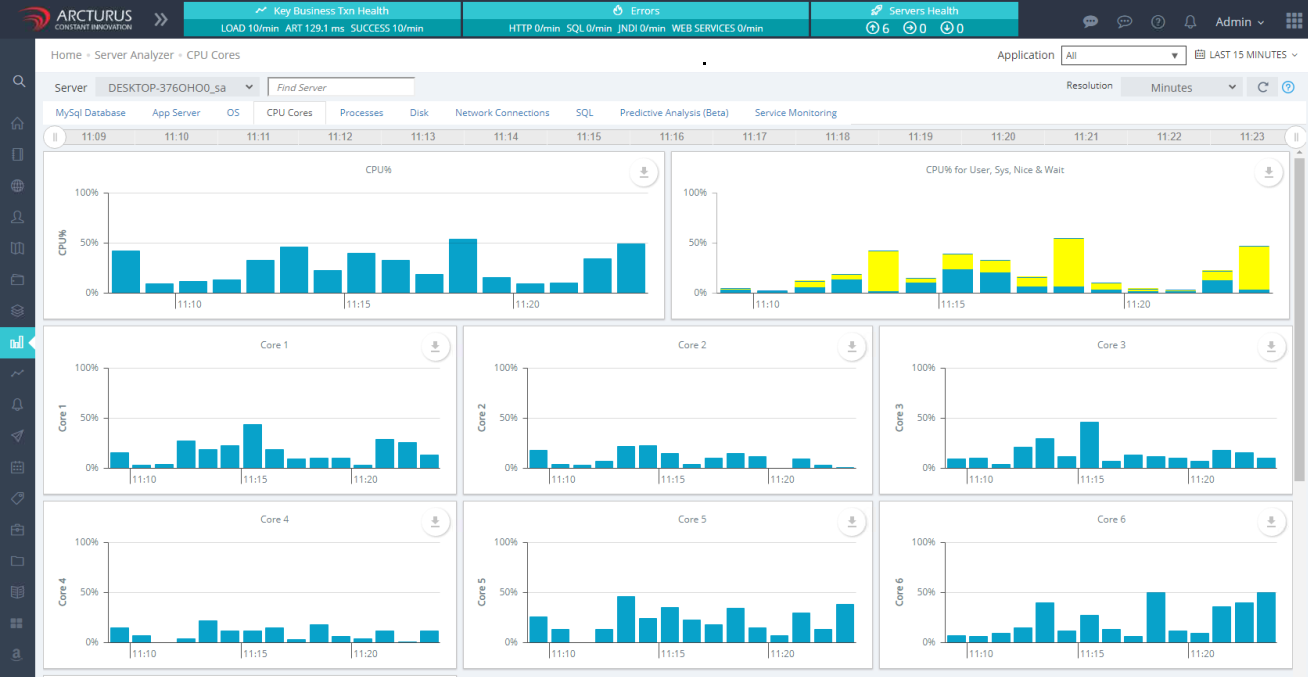
CPU CORE Analyzer
This view presents an overview of the overall CPU as well as detailed information about each individual CPU core.
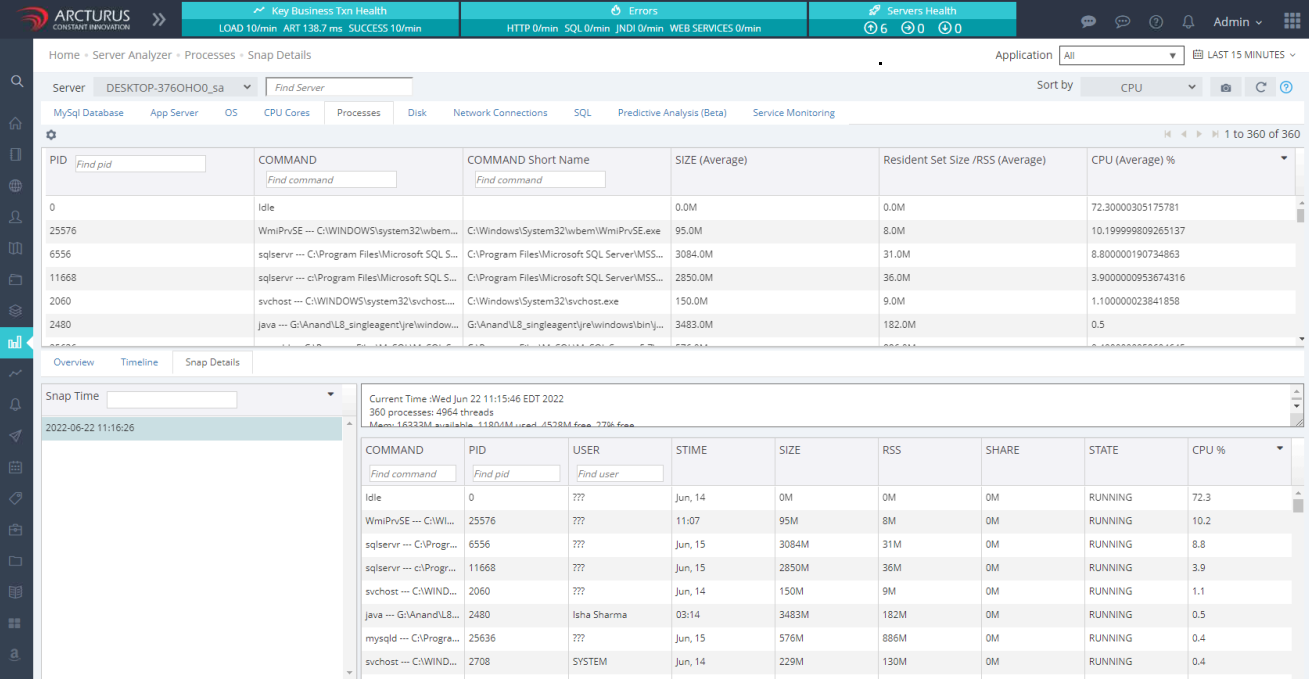
Processes
This view offers organized performance stats for CPU, memory and running processes. It includes historical snapshots of various processes, showing their resources consumption at specific times. By default, Applicare captures these snapshots every 10 minutes but you can adjust by changing the interval as needed.
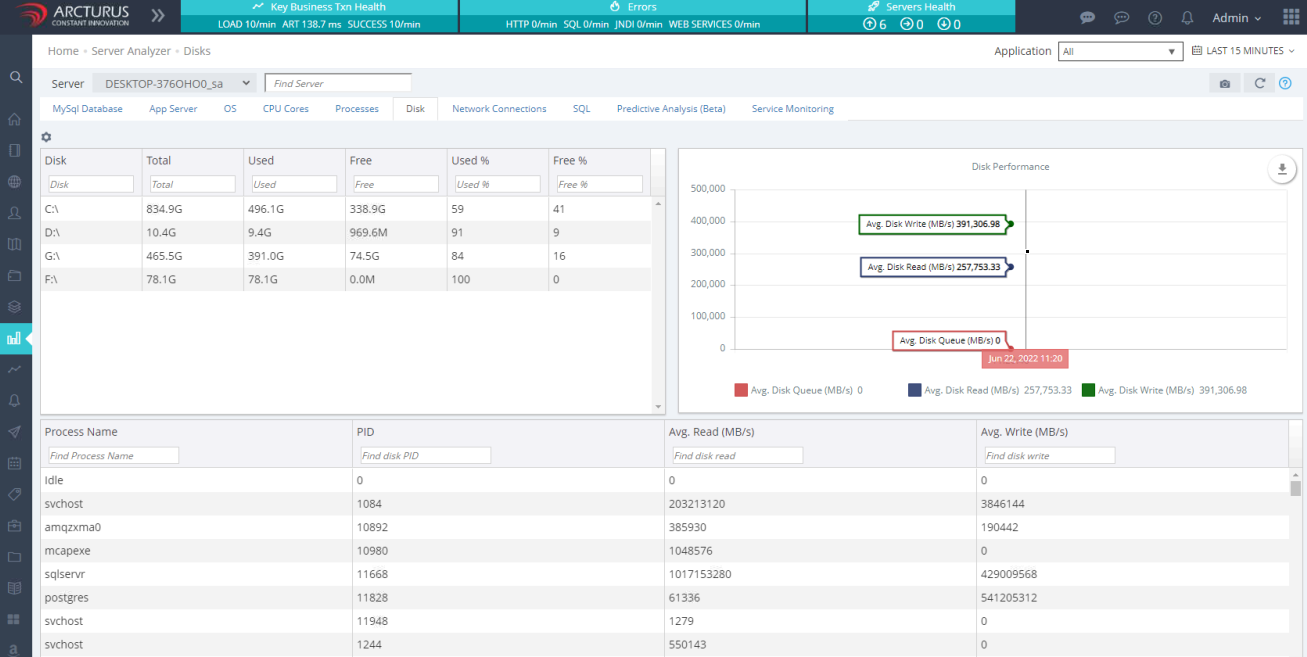
Disk
This view displays the disk usage for each individual process.
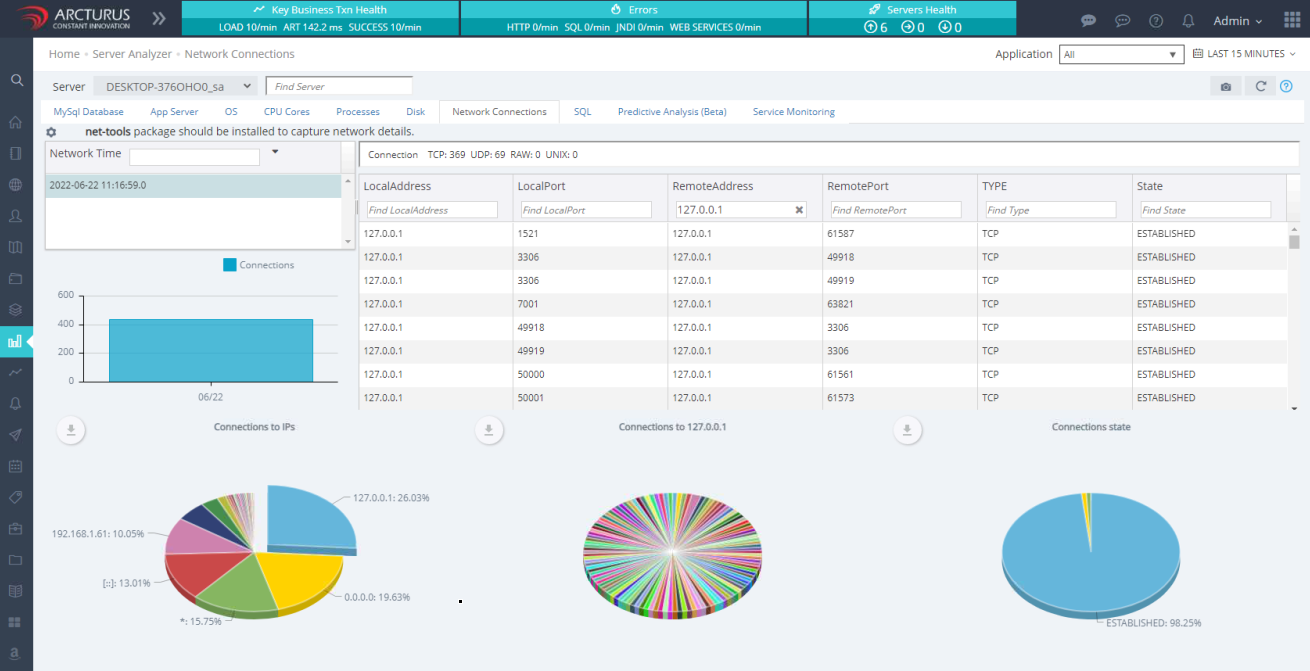
Network Connections
This view offers detailed information on TCP, UDP, RAW, and UNIX connection.
SQL Report
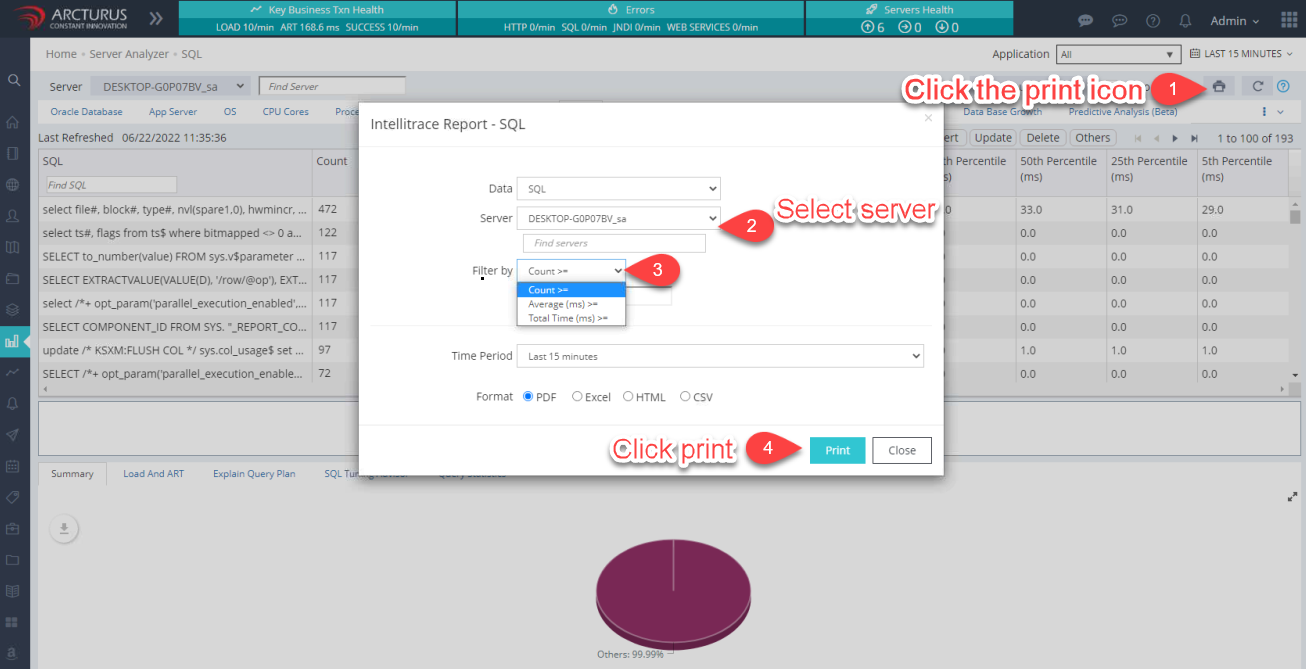
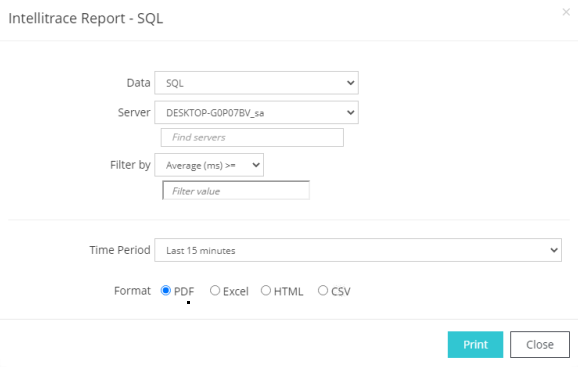
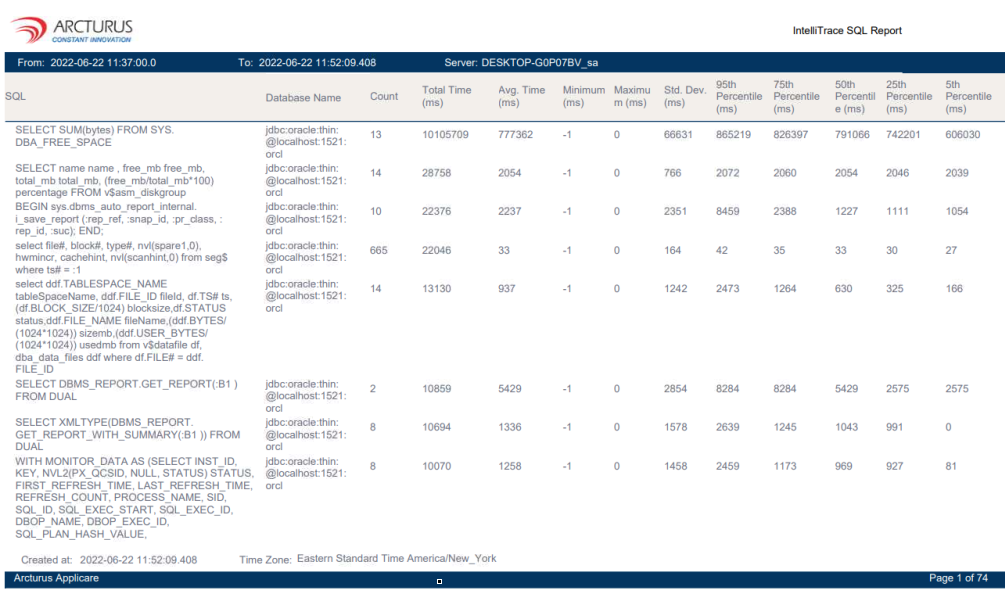
You can download SQL statements as a report by clicking the print icon on the SQL Screen within the Server Analyzer menu.