
1. Create an applicare-setup.yml file with the below content:
apiVersion: v1
kind: Namespace
metadata:
  name: applicare
---
apiVersion: v1
kind: ServiceAccount
metadata:
  name: applicare
  namespace: applicare
---
apiVersion: rbac.authorization.k8s.io/v1
kind: ClusterRole
metadata:
  name: applicareapi-cluster-role
rules:
  # Core inventory + storage objects
  - apiGroups: [""]
    resources:
      - nodes
      - namespaces
      - pods
      - services
      - events
      - endpoints
      - configmaps
      - persistentvolumeclaims
      - persistentvolumes
      - replicationcontrollers
    verbs: ["get", "list", "watch"]
  # Container log reads (fixes "Failed to get log details ... 403")
  - apiGroups: [""]
    resources:
      - pods/log
    verbs: ["get"]
  # Kubelet Summary API + cAdvisor via the API-server proxy:
  #   GET /api/v1/nodes/<node>/proxy/stats/summary     -> pod disk (ephemeral + PVC) and network
  #   GET /api/v1/nodes/<node>/proxy/metrics/cadvisor  -> CPU throttling
  # nodes/proxy is a distinct RBAC subresource; granting "nodes" above does NOT cover it.
  - apiGroups: [""]
    resources:
      - nodes/proxy
      - nodes/stats
      - nodes/metrics
    verbs: ["get"]
  # Resource quotas per namespace (near-limit alerting)
  - apiGroups: [""]
    resources:
      - resourcequotas
      - limitranges
    verbs: ["get", "list", "watch"]
  # Events via the newer events.k8s.io API group
  - apiGroups: ["events.k8s.io"]
    resources:
      - events
    verbs: ["get", "list", "watch"]
  # CPU / memory metrics (KubernetesNodesMetrics / ContainerMetrics jobs)
  - apiGroups: ["metrics.k8s.io"]
    resources:
      - nodes
      - pods
    verbs: ["get", "list"]
  # Workload objects (desired-vs-ready replica health)
  - apiGroups: ["apps"]
    resources:
      - deployments
      - replicasets
      - statefulsets
      - daemonsets
    verbs: ["get", "list", "watch"]
  # Batch workloads (Job / CronJob failure monitoring)
  - apiGroups: ["batch"]
    resources:
      - jobs
      - cronjobs
    verbs: ["get", "list", "watch"]
  # Ingress resources — topology Ingress→Service→Pod chain
  - apiGroups: ["networking.k8s.io"]
    resources:
      - ingresses
      - ingressclasses
    verbs: ["get", "list", "watch"]
---
apiVersion: rbac.authorization.k8s.io/v1
kind: ClusterRoleBinding
metadata:
  name: applicareapi-cluster-role-binding
subjects:
  - kind: ServiceAccount
    name: applicare
    namespace: applicare
roleRef:
  apiGroup: rbac.authorization.k8s.io
  kind: ClusterRole
  name: applicareapi-cluster-role
---
apiVersion: v1
kind: Secret
metadata:
  name: applicare-token
  namespace: applicare
  annotations:
    kubernetes.io/service-account.name: applicare
type: kubernetes.io/service-account-token
2. Execute the below command in the same directory where the file was created:
kubectl apply -f applicare-setup.yml3. Execute kubectl top nodes in the kubernetes.

- If you are not able to view the below details, then: Install metrics pod in Kubernetes. Execute the below command to install metrics pod:
- Check if the metrics server is running by executing the below command.
- kubectl get pods -n kube-system
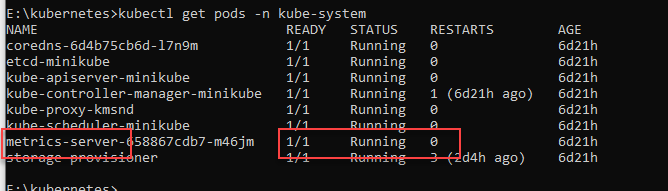
If it is still not running, then follow the below steps:
- Step 1: Edit the configuration file by executing the below command.
kubectl edit deployments.apps -n kube-system metrics-server- Step 2: Add the below lines in the spec: container: args: and save the file.
- --kubelet-insecure-tls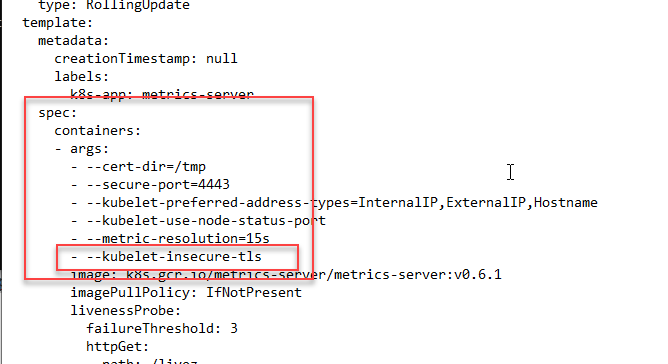
- Step 3: After a few minutes, execute the command kubectl get pods -n kube-system and check if the metrics server is running.
- If it is not running, then: Edit the configuration file by executing the command kubectl edit deployments.apps -n kube-system metrics-server modify the below lines in the spec: container: args: and save it.
- --kubelet-preferred-address-types=InternalIP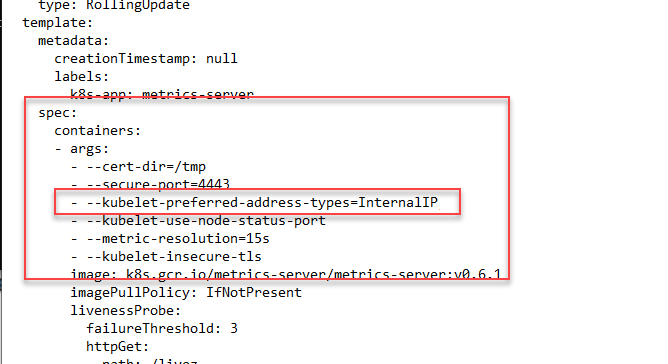
- Step 4: To verify the metrics API server is running, execute the below command and check kubectl top nodes.

4. Refer here to install SingleAgent and start.
- Once we start the agent it will be added to Applicare Console.
5. Execute the below command one by one to get the Cluster IP and Token. Copy the $APISERVER and $TOKEN value for configuration.
To get APISERVER and TOKEN in PowerShell:
$APISERVER = kubectl config view --minify -o jsonpath='{.clusters[0].cluster.server}'
Write-Host "APISERVER: $APISERVER"
$TOKEN = kubectl get secret applicare-token -n applicare -o jsonpath='{.data.token}' | ForEach-Object { [System.Text.Encoding]::UTF8.GetString([System.Convert]::FromBase64String($_)) }
Write-Host "TOKEN: $TOKEN"
To get APISERVER and TOKEN in Bash
APISERVER=$(kubectl config view --minify -o jsonpath='{.clusters[0].cluster.server}')
echo "APISERVER: $APISERVER"
TOKEN=$(kubectl get secret applicare-token -n applicare -o jsonpath='{.data.token}' | base64 --decode)
echo "TOKEN: $TOKEN"
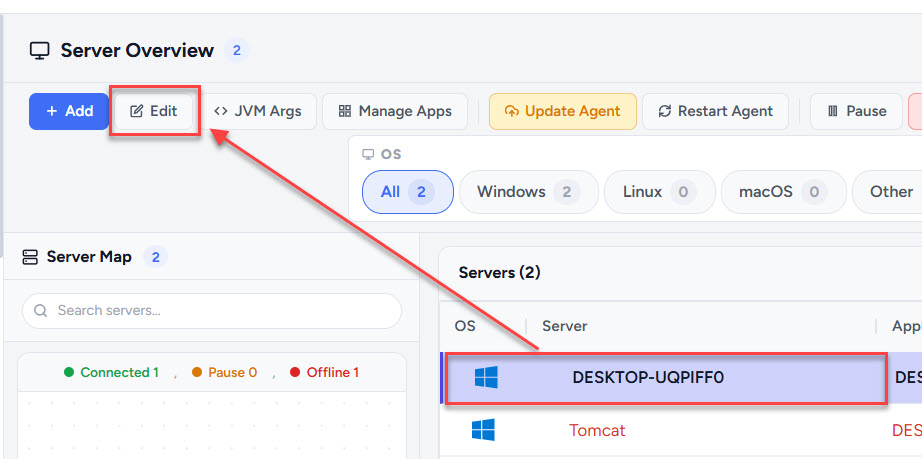
6. Login into the Applicare console and go to the Overview screen. Select the newly added server and click the Edit button.
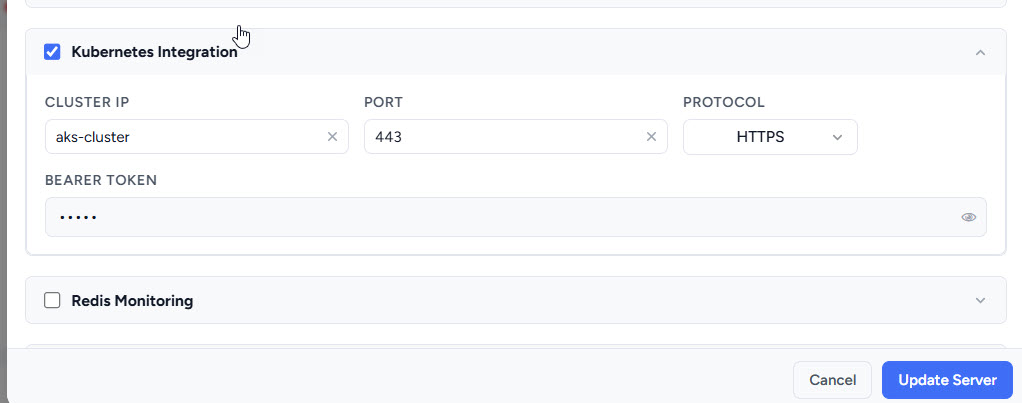
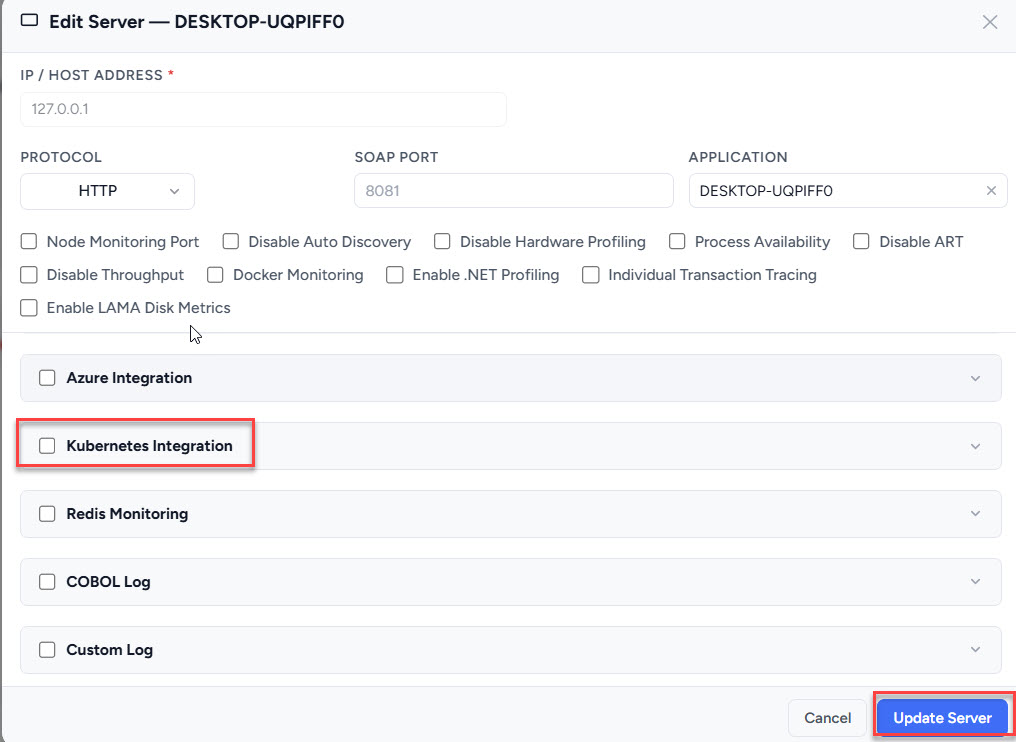
- Enable the Kubernetes Integration checkbox and add the configuration details.
8. Remove the "https:// (or) http://" and port in APISERVER value and Paste the remaining value in the CLUSTER IP field.
9. Copy the TOKEN value and paste it in the BEARER TOKEN field.
10. Enter the Kubernetes running port in the PORT field.
11. Select the Kubernetes protocol from the PROTOCOL dropdown. Protocol details will be available in the APISERVER. "https:// (or) http://"
12. Click the Update Server button.
- Note: We can edit or delete the Kubernetes configuration from both the Overview or Kubernetes menu.
Overview Menu
Update
- Select the row and click the Edit button to update details and then click the Update button.
Delete
- Select the row and click the Edit button and Uncheck the Add the Kubernetes Monitoring checkbox. Then, click the Update button.
Kubernetes Menu
Update
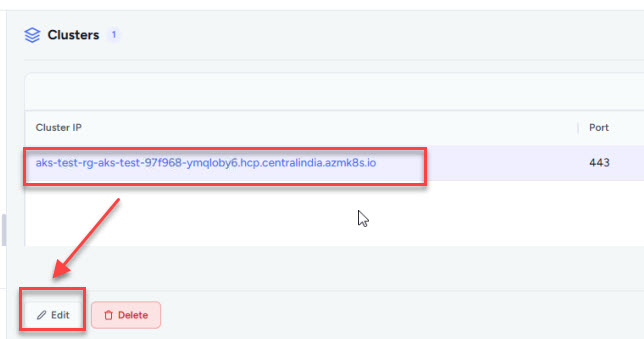
- Select the row and click the Edit button to update details. Then, click the Save button.
Delete
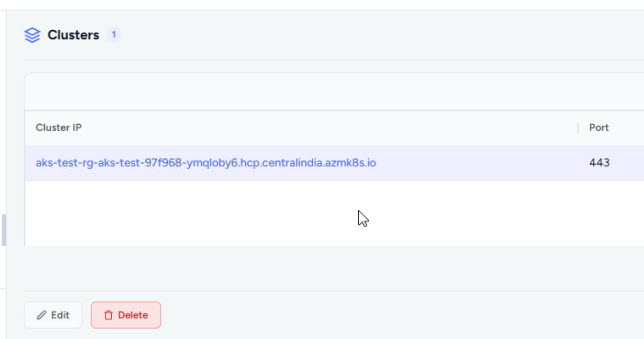
- Select the row and click the Delete button.
Note: We can edit or delete the Kubernetes configuration from both the Overview or Kubernetes menu.
Uninstall the Applicare Kubernetes monitor service account and secrets.
kubectl delete namespace applicare
kubectl delete clusterrole applicareapi-cluster-role
kubectl delete clusterrolebinding applicareapi-cluster-role-binding