Applicare log monitoring allows you to search and find information spread across log files from applications and servers through a single, intuitive interface. Its seamless integration with IntelliSense and Business Transaction Monitoring allows you to quickly focus on relevant sections of logs files for any transaction with just a few clicks.
Configuration
Applicare can monitor any log file accessible by a monitored server / agent. You can provide the absolute path to the log file or a directory containing log files. If the provided path is a directory, all log files found in the directory will be monitored.
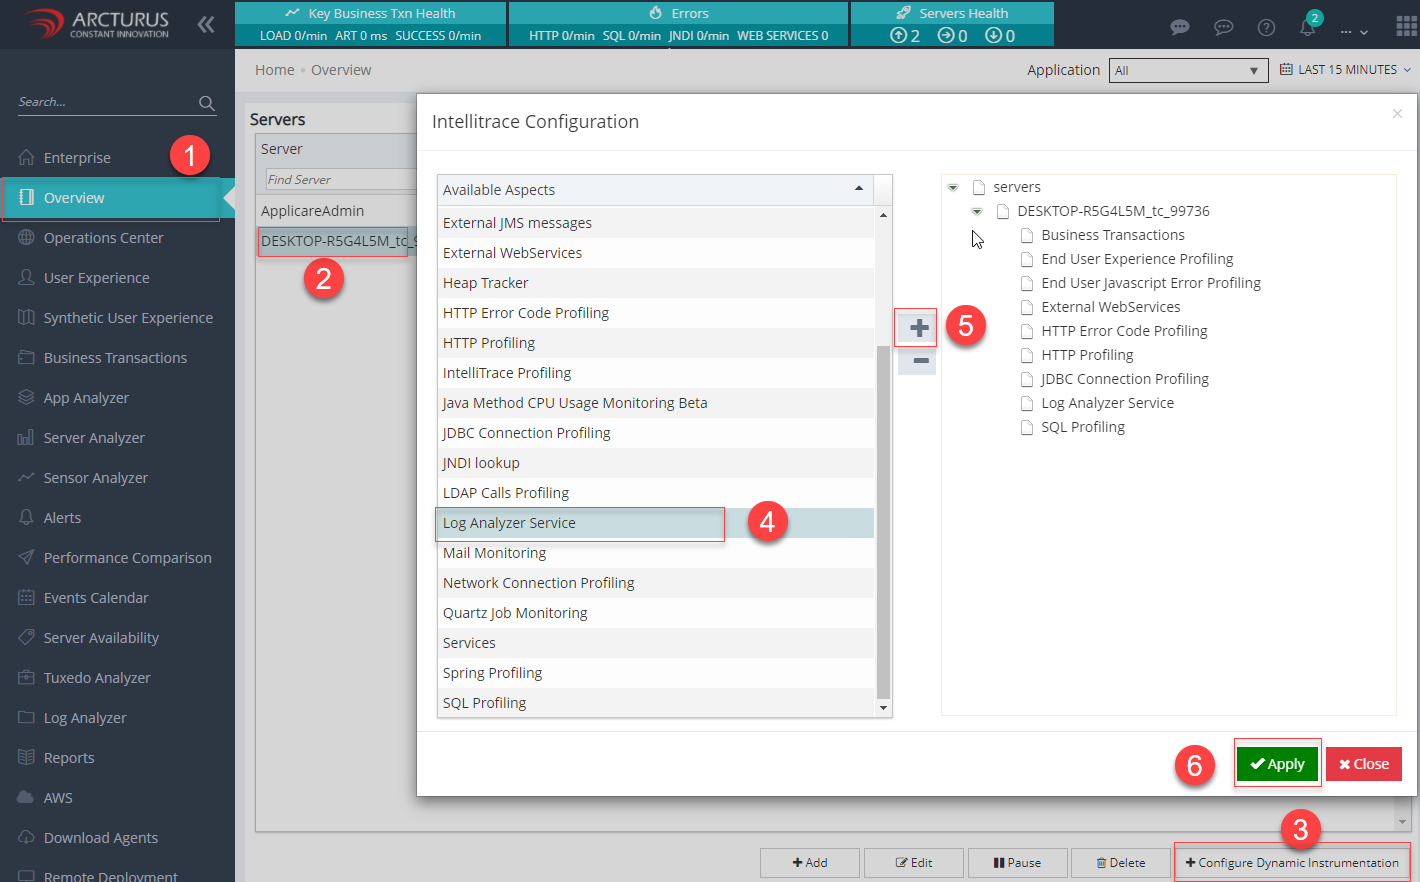
By default, the Log Analyzer Service aspect is available for all agents. If it is not available, follow these Steps to add that Aspect.
Step 1: Go to Overview Menu, select the server, click the Configure Dynamic Instrumentation button and add the Log Analyzer Service to the server.
Step 2: Navigate to the LogAnalyzer Menu -> LogMonitor Configuration to add the logs.
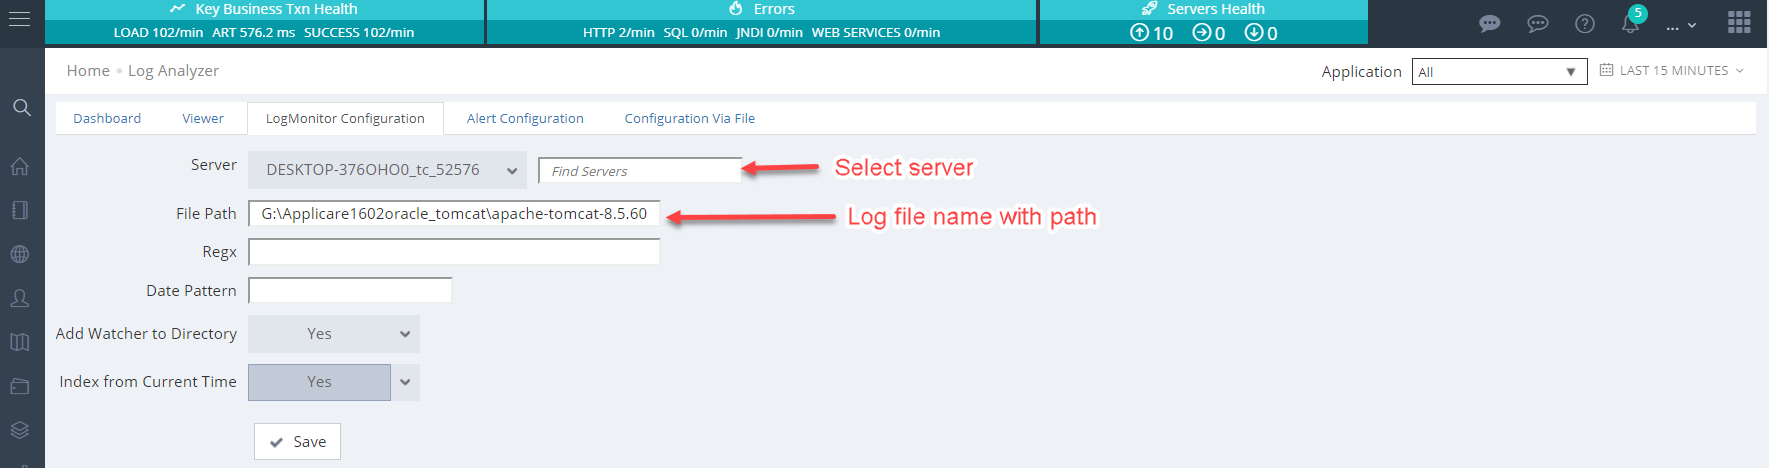
Example: Assume the Applicare Agent is installed in the D: drive and you want to add the Applicare Agent log for monitoring.
Select the Applicare Agent name from the Server dropdown.
Copy the Applicare Agent log path.
Paste the path into the File Path field.
Example log path:
D:\ApplicareSingleAgentWindows\logs\IIS.log
Log Monitor Configuration
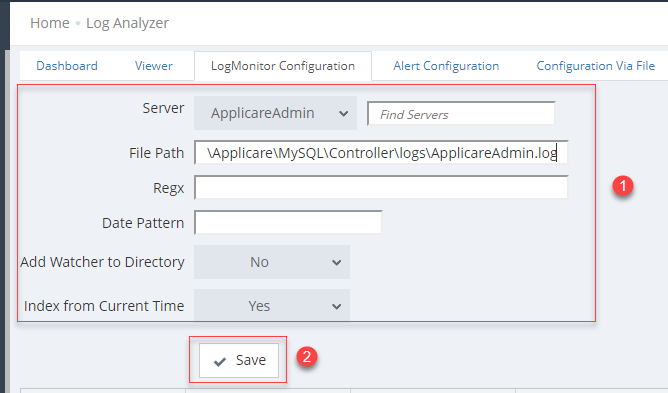
1. Go to Log Analyzer - Log Monitor Configuration menu.
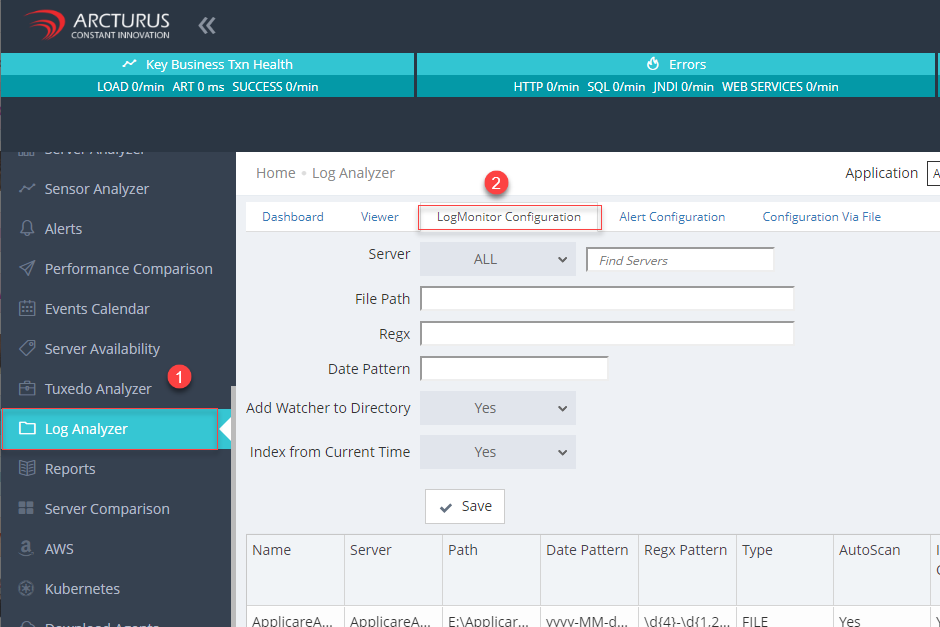
2. Enter the details and click the save button to save the changes.
Server - Select the Server to which we are going to add the logs.
File Path - Either you can provide the directory path or file path.
Regex Date Pattern - Leave empty.
Add watcher to Directory - Applicable for directories.
- Yes - The system will automatically monitor any new log files created in the directory.
- No - The system will not monitor new log files in the directory.
Index From Current Time - Choose whether to start monitoring logs from the current time.
- Yes - Monitoring will begin from the current time.
- No - Monitoring will include both new and existing records.
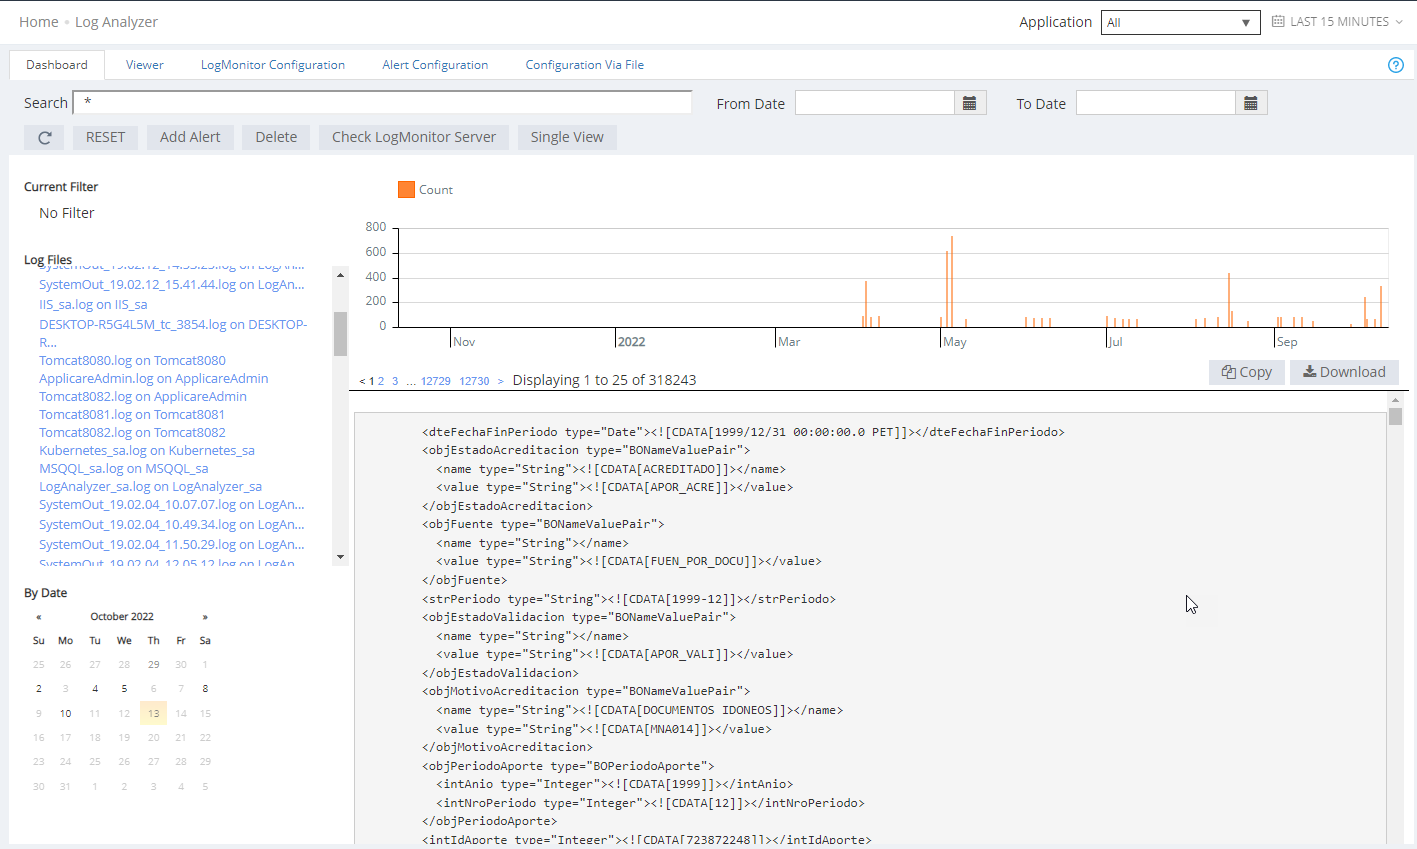
Dashboard
With the Log Analyzer, you can search through all your logs files from a single UI. You can refine search results by specifying a date/time range and further filter by log file or date using the dynamic filters on the left. By default, records are displayed in descending order based on the log date and time.
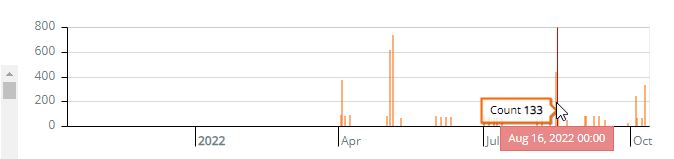
- Graph - Displays the count of records per day.
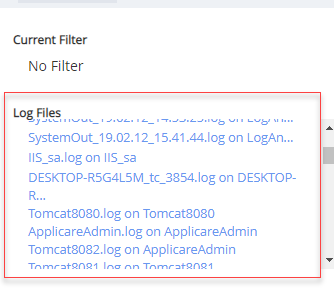
- Log Files - It will display the log file path and names based on the search result. By clicking on the Log file name it will filter the records available in that particular log files.
- Calendar - The calendar highlights days with log records in bold. Hovering over a highlighted day will display the count of log records for that day.
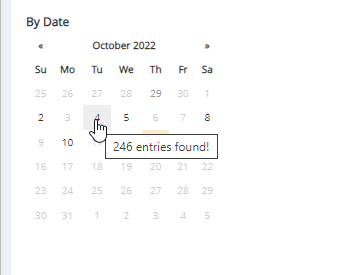
- Pagination - By default, 25 records are shown per page. Use the page numbers to navigate to the pages.

- Copy button - Copies the records currently displayed on the page.

- Download button - Downloads the records currently displayed on the page as a text file.

Single View
1. Enter your search query in the field and press Enter to search the records.
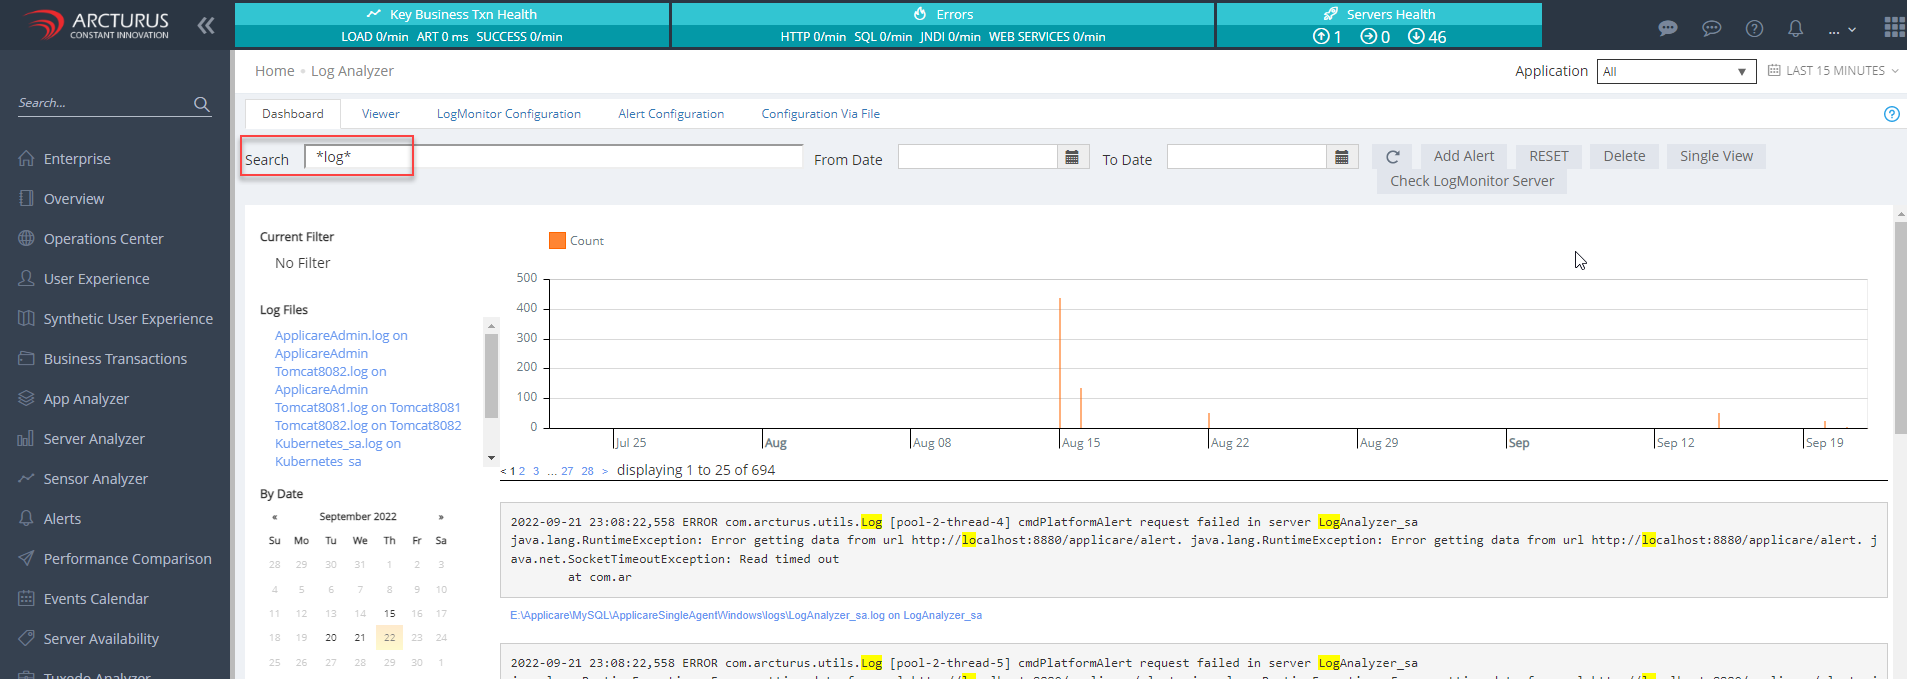
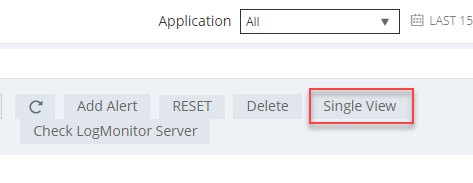
2. Click the Single View button.
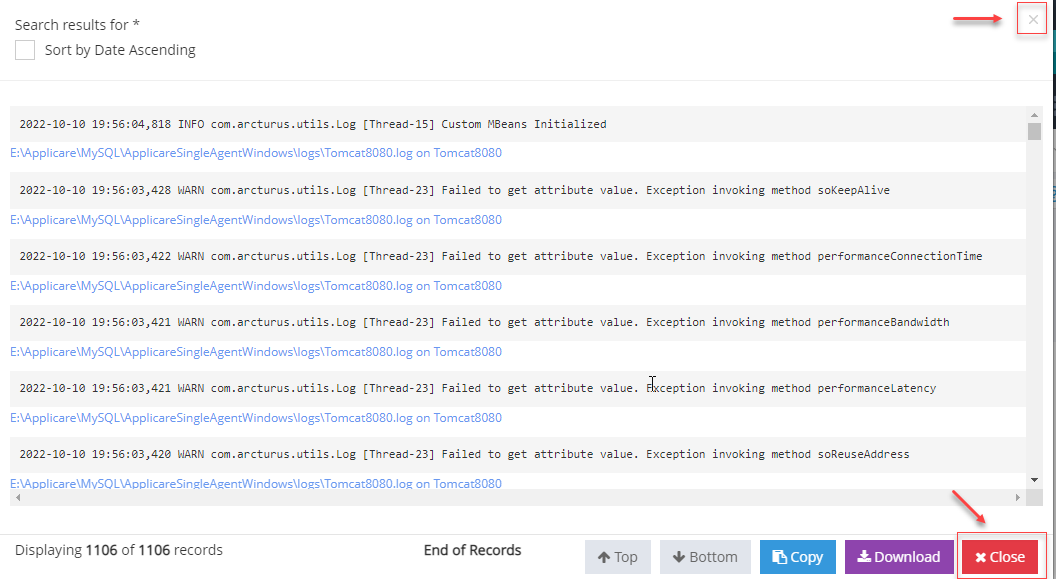
3. A popup will appear, Displaying up to 1000 records by default.
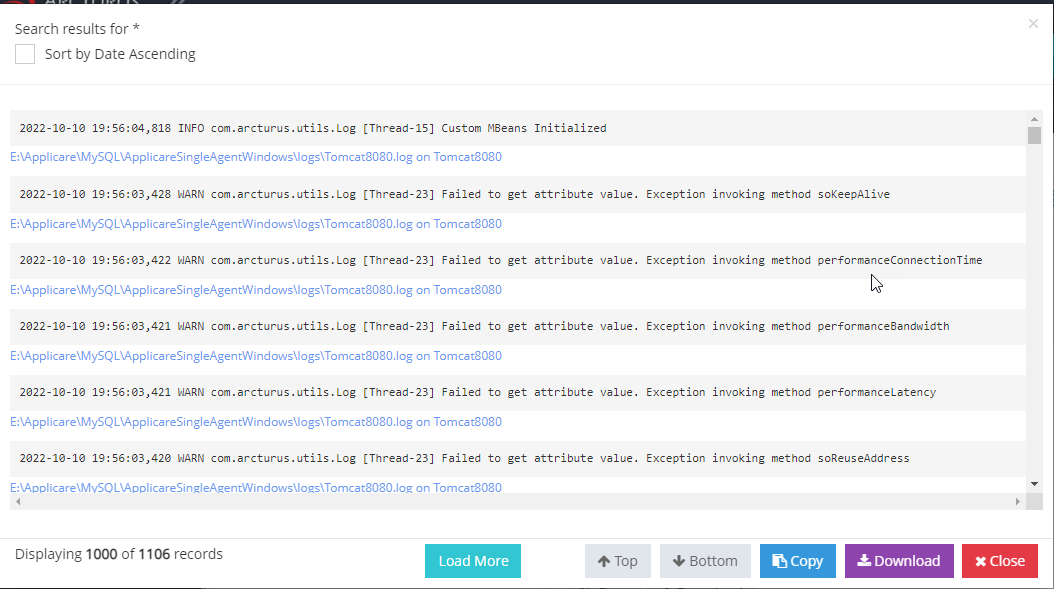
4. To load additional records, click the Load More button.
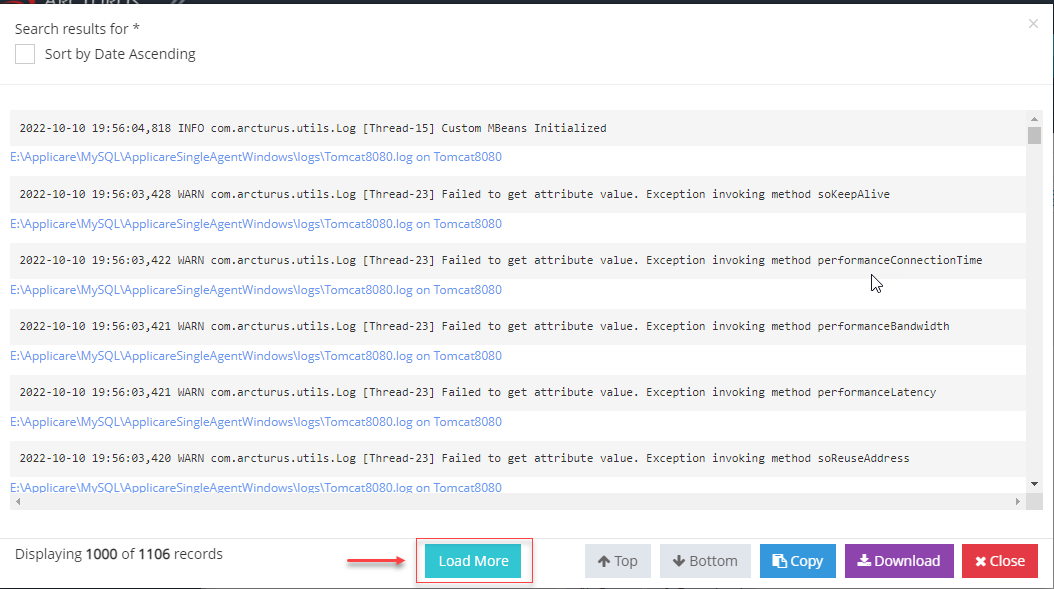
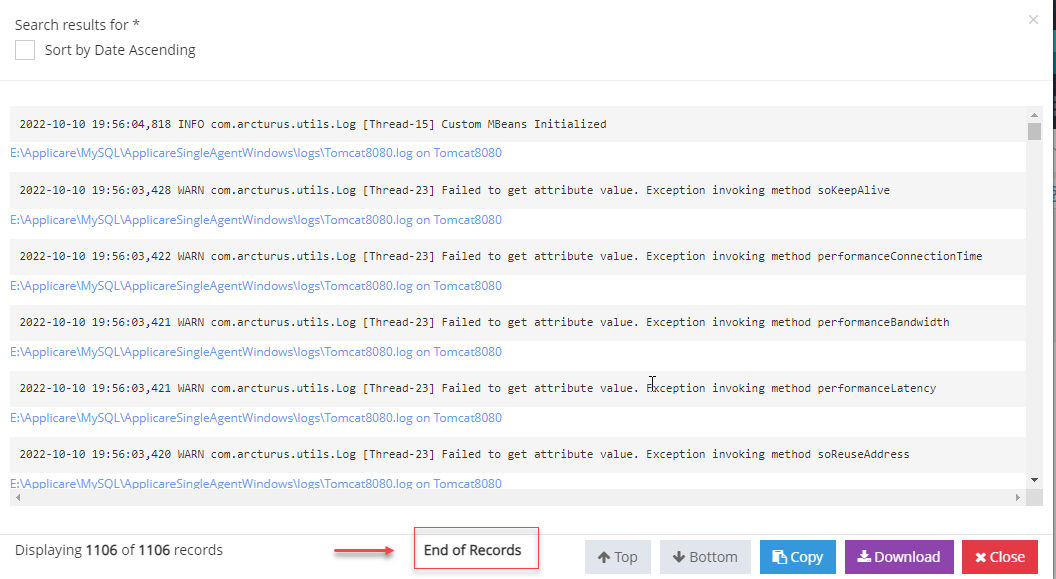
When all records have been loaded, you will see a message indicating End of records.
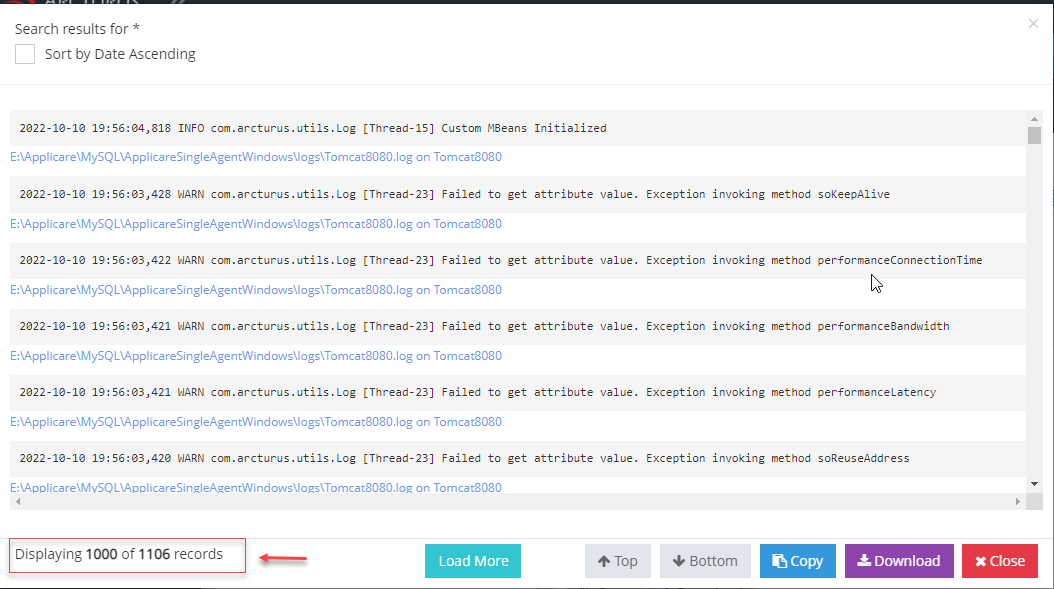
5. The count of loaded records will be displayed on the left-hand side.
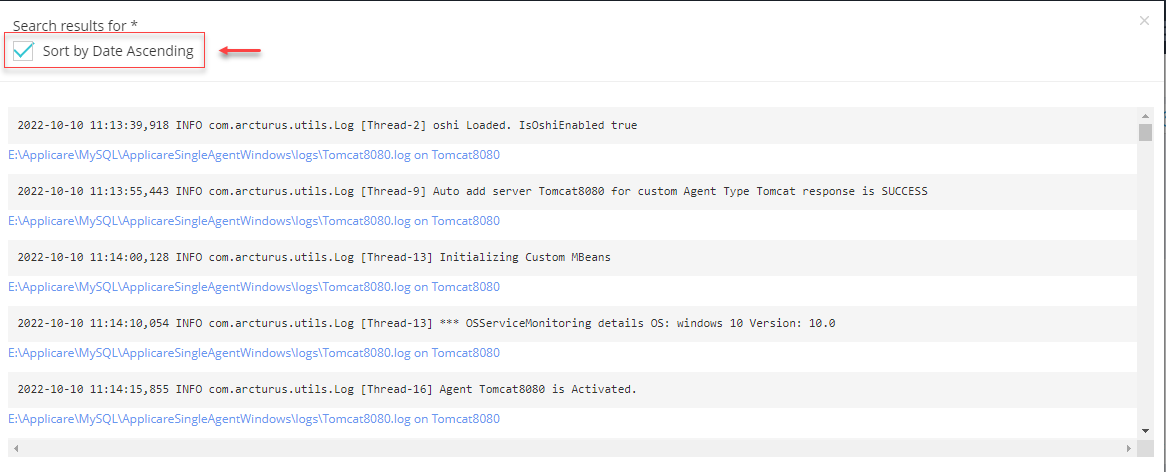
6. By default, records are loaded in descending order based on log date and time.
- To sort the records in ascending order, select the Date ASC check box.
- To sort the records in descending order, clear the Date ASC check box.
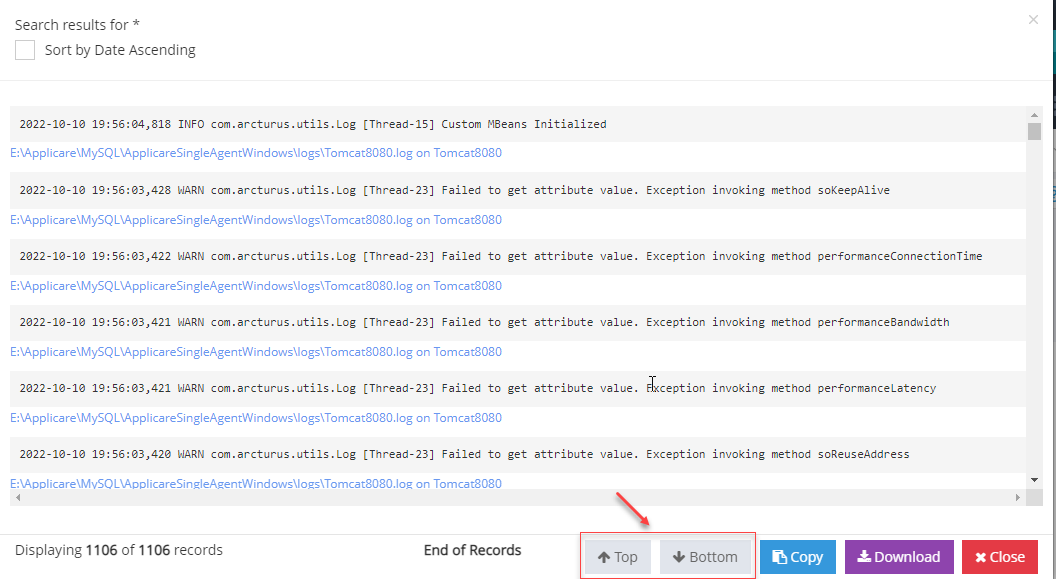
7. Click the Top and Bottom buttons to scroll to the top and bottom of the records. Clicking Bottom will not only scroll to the end but also load the next set of 1000 records.
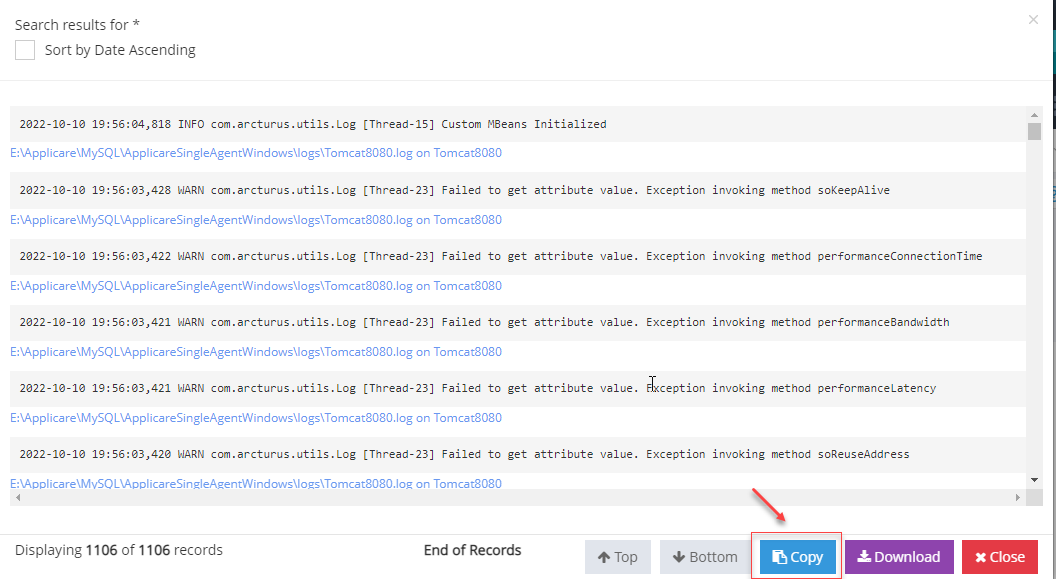
8. Click the Copy button to duplicate the currently loaded records.
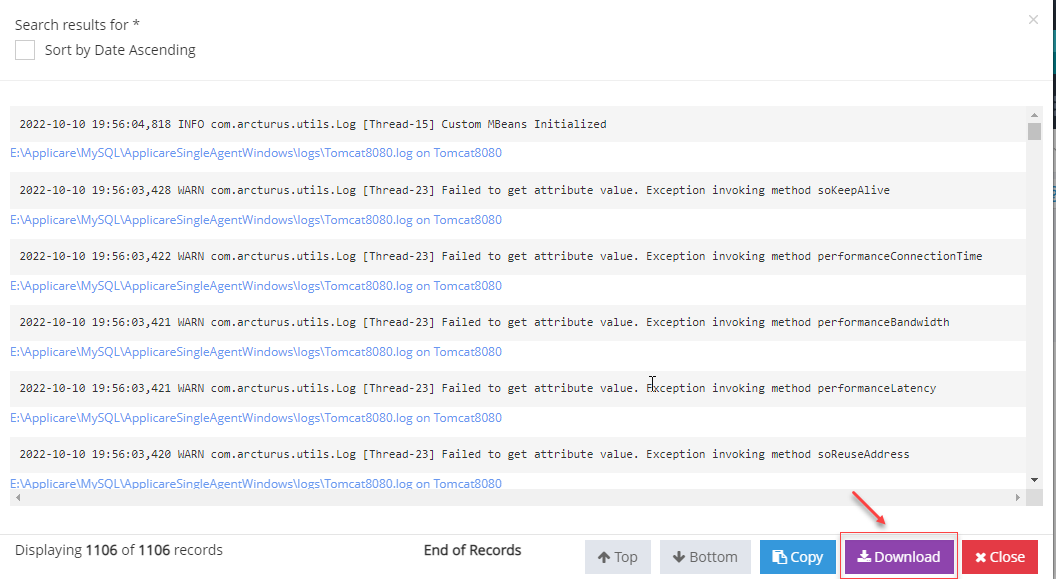
9. Click the Download button to save the loaded records as a text file.
10. Close Popup - To close the popup, click either the close button at the bottom or the close icon at the top of the popup.