
- Install Applicare SingleAgent in the machine that WebSphere is running in.
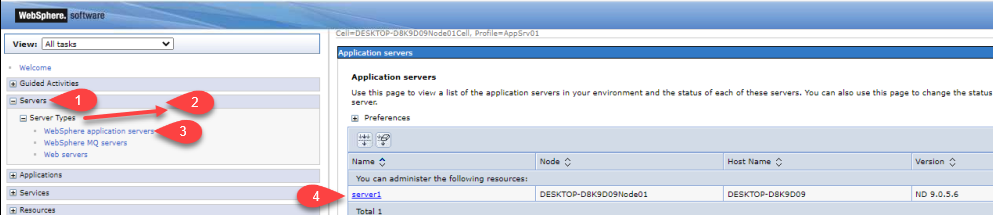
- Log in to the Websphere console and navigate servers> server Types > Websphere application servers, and then select the server.
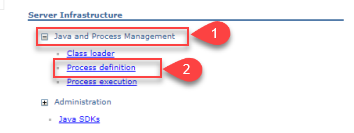
- Click on Java and Process Management> Process definition under the Server Infrastructure section.
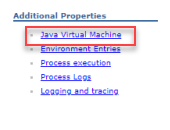
- In the additional properties section, click on Java Virtual Machine.
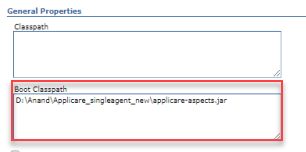
- Save the value in the boot classpath as shown below
<ApplicareSingleagent_homepath>\applicare-aspects.jar- <ApplicareSingleagent_homepath> - refers to the directory where the Applicare SingleAgent zip file extracted.
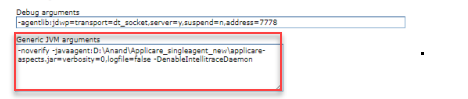
- Save the value as shown below the Generic JVM arguments.
-noverify -javaagent:<ApplicareSingleagent_homepath>\applicare-aspects.jar=verbosity=0,logfile=false- Note: <ApplicareSingleagent_homepath> - Applicare SingleAgent zip file extracted directory.
- Next, add the following custom properties by clicking the Custom Properties link under Additional Properties heading on the same page.

| Name | Value | Description |
|---|---|---|
| Arcturus_home | <ApplicareSingleagent_homepath> | Absolute path to your ApplicareSingleagent_homepath directory |
| java.awt.headless | True | |
| java.library.path | <ApplicareSingleagent_homepath>/bin | The full path to your ApplicareSingleagent_homepath directory |
| profile.name | <Profile Name> | The profile name you used when configuring the profile in Applicare console |
| server.name | <Server Name> | Name of your WebSphere server |
- Restart the WebSphere server to apply the changes.