
The OS Internals Analyzer offers a quick and convenient view into your physical server's processes, network activity, CPU usage, memory and storage performance.
Charts
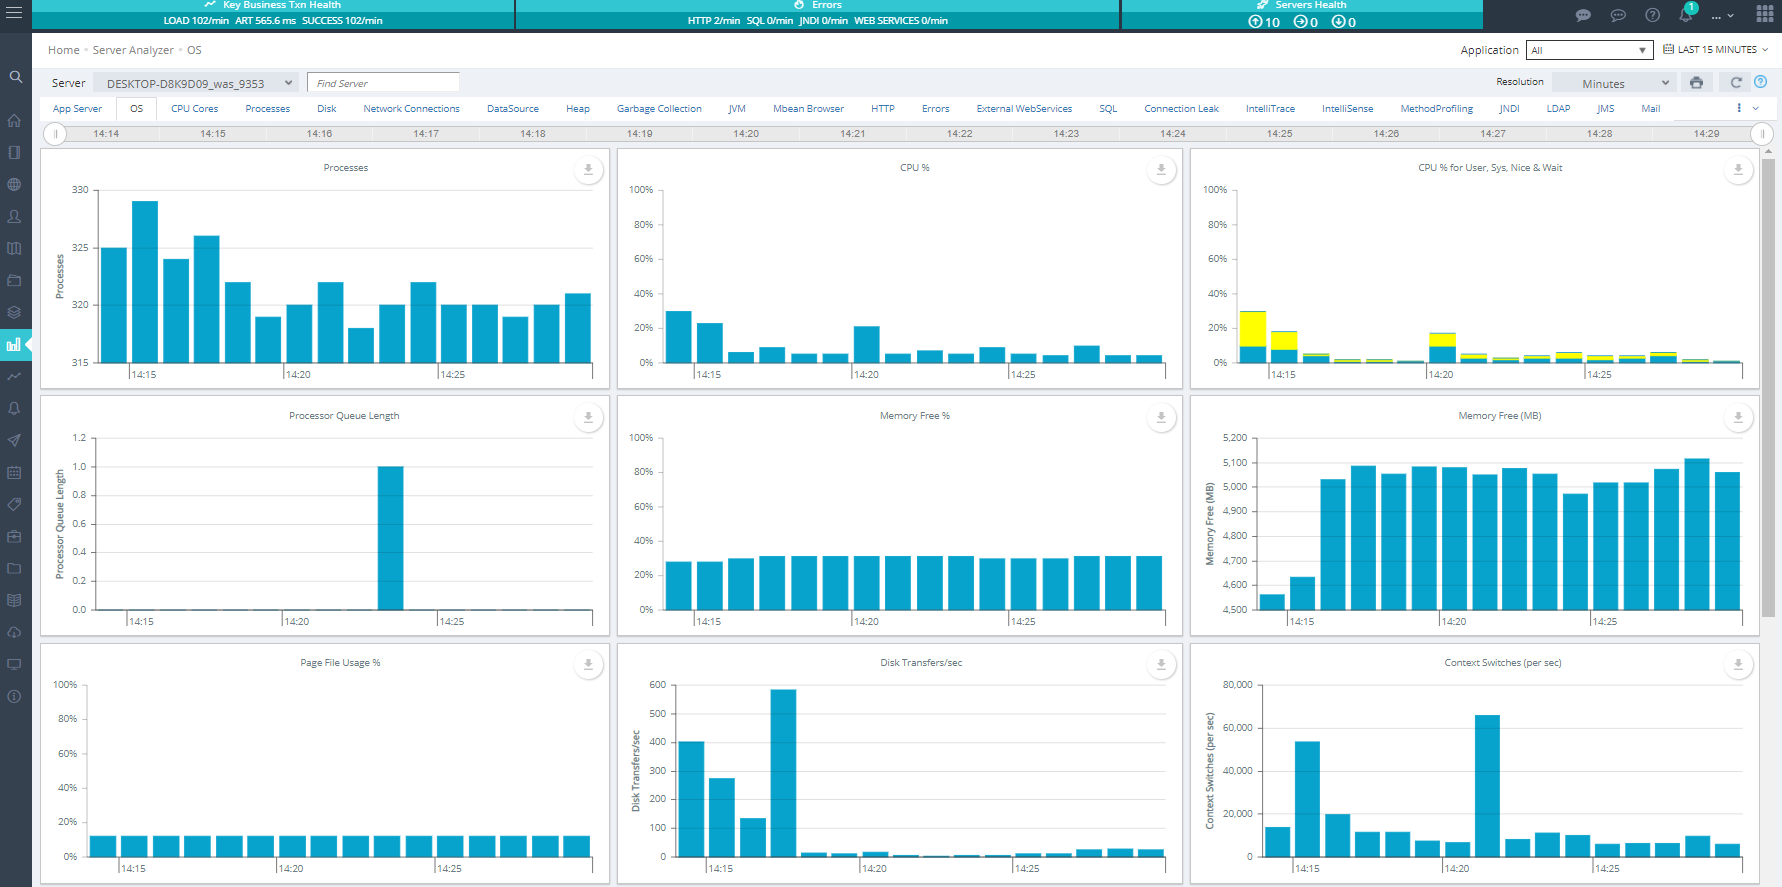
This tab allows you to monitor overall system performance visually through graphical representations. You can monitor your server's memory usage, system load, CPU utilization, context switching, and network data.
Processes
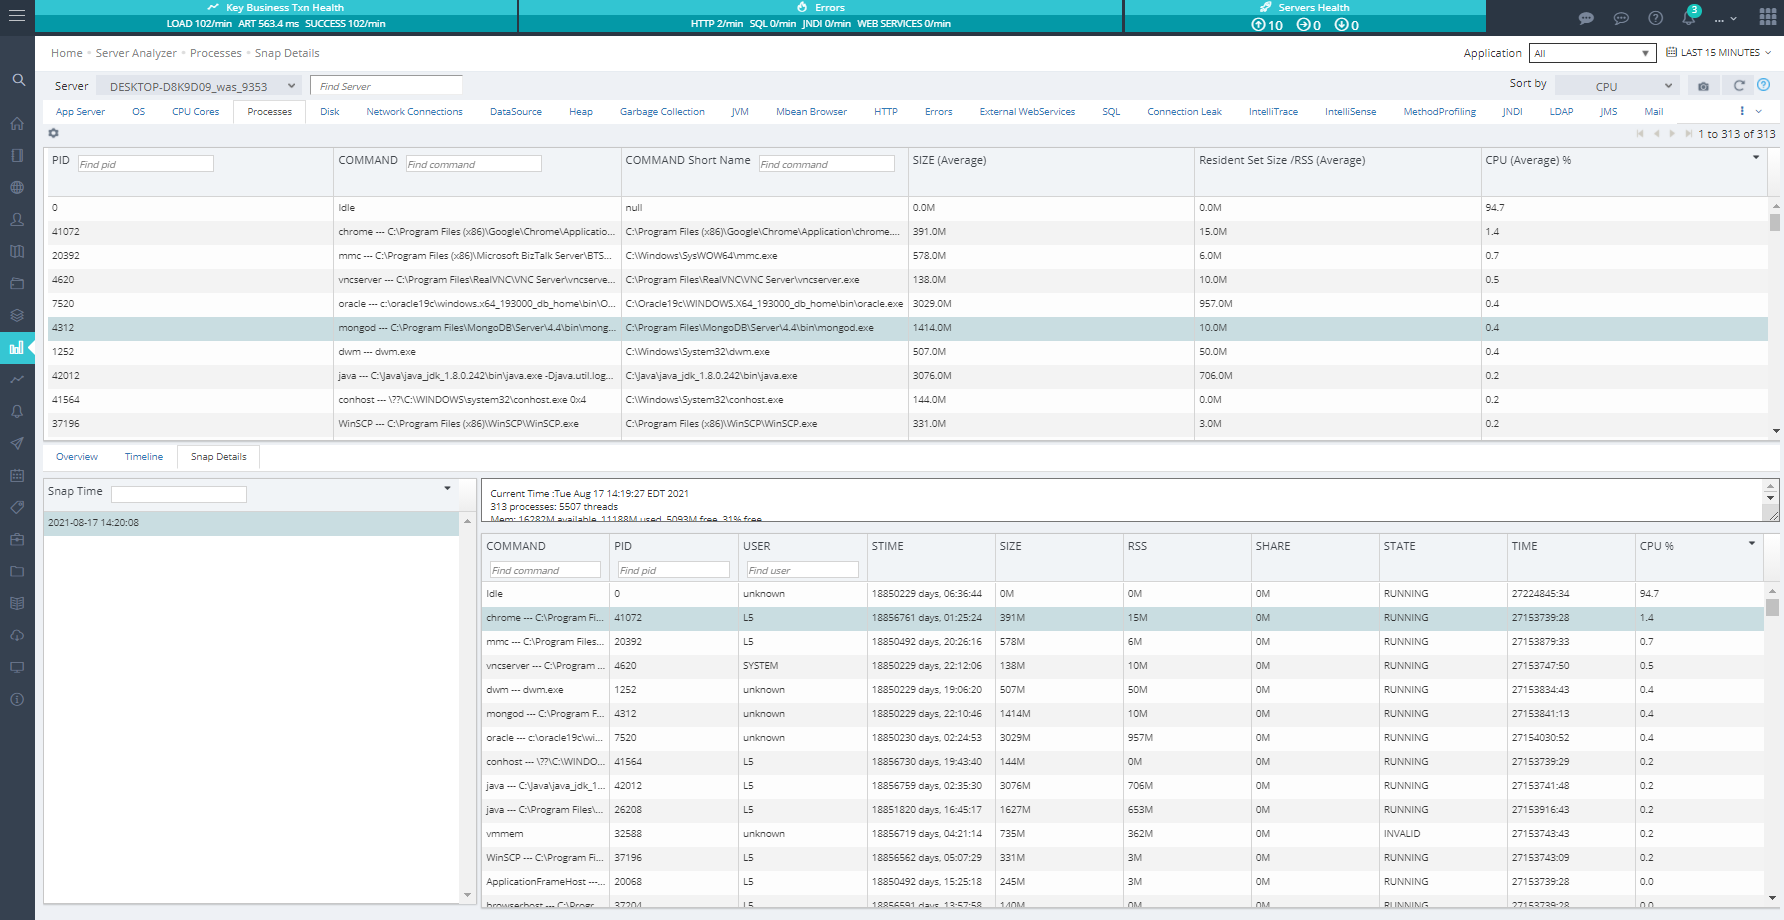
This view displays performance stats for CPU, memory and running processes, organized similarly to the output of the Top utility on Unix-based systems.
Column Descriptions:
| PID : | The process ID assigned to each task. |
|---|---|
| USER : | The username of the task's owner. |
| STIME : | The time when the process was initiated. |
| SIZE : | The size of the task's code, data and stack space, displayed in megabytes, is shown here. |
| RSS : | The total amount of physical memory used by the task, measured in megabytes, is shown here. |
| SHARE : | This column displays the amount of shared memory used by the task. |
| STATE : | This column indicates the task's state, which can be S for sleeping, D for uninterruptible sleep, R for running, Z for zombies, or T for stopped or traced. |
| TIME : | The total CPU time utilized by the task since its start, displayed in MM. |
| CPU : | The task's current CPU time usage, expressed as a percentage. |