Overview
The App Analyzer is designed to evaluate the performance of an entire enterprise application, providing comprehensive insights into various transactions, SQL queries and other metrics across all servers that support the application.
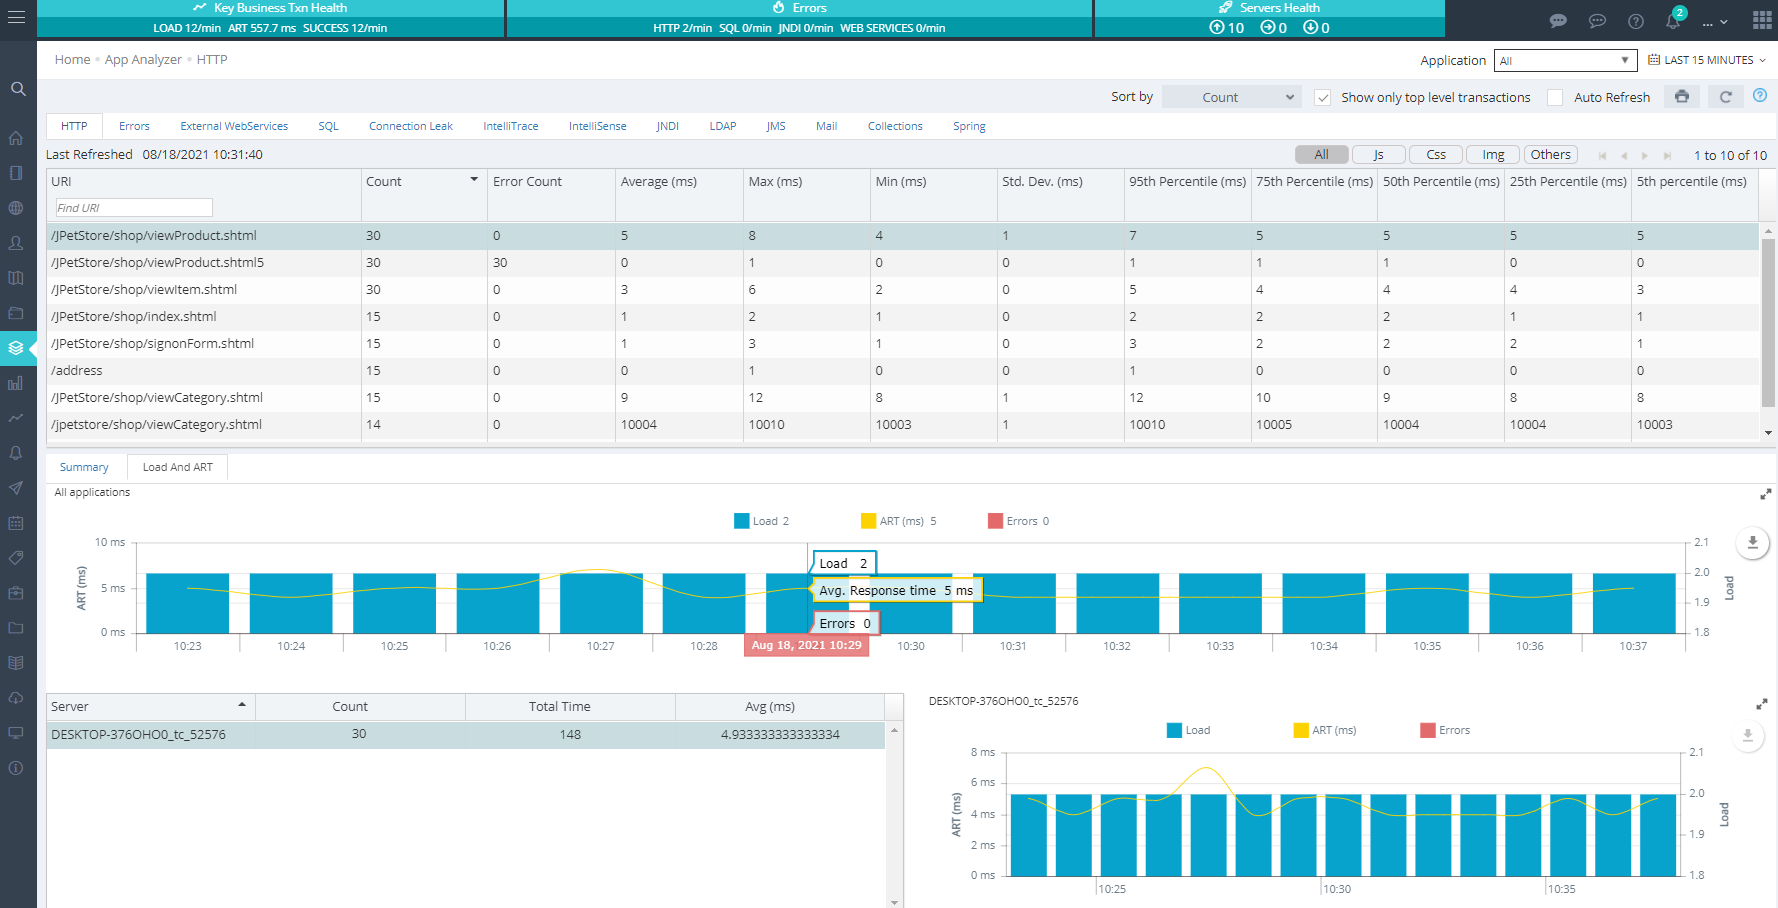
HTTP
The top table displays URI along with its performance metrics, including count, average and performance percentiles. Selecting a row will reveal the performance details for that URI within the chosen time period in the central chart. On bottom left, performance is shown on all the servers in the application and on bottom right is the chart showing comparative performance across all servers.
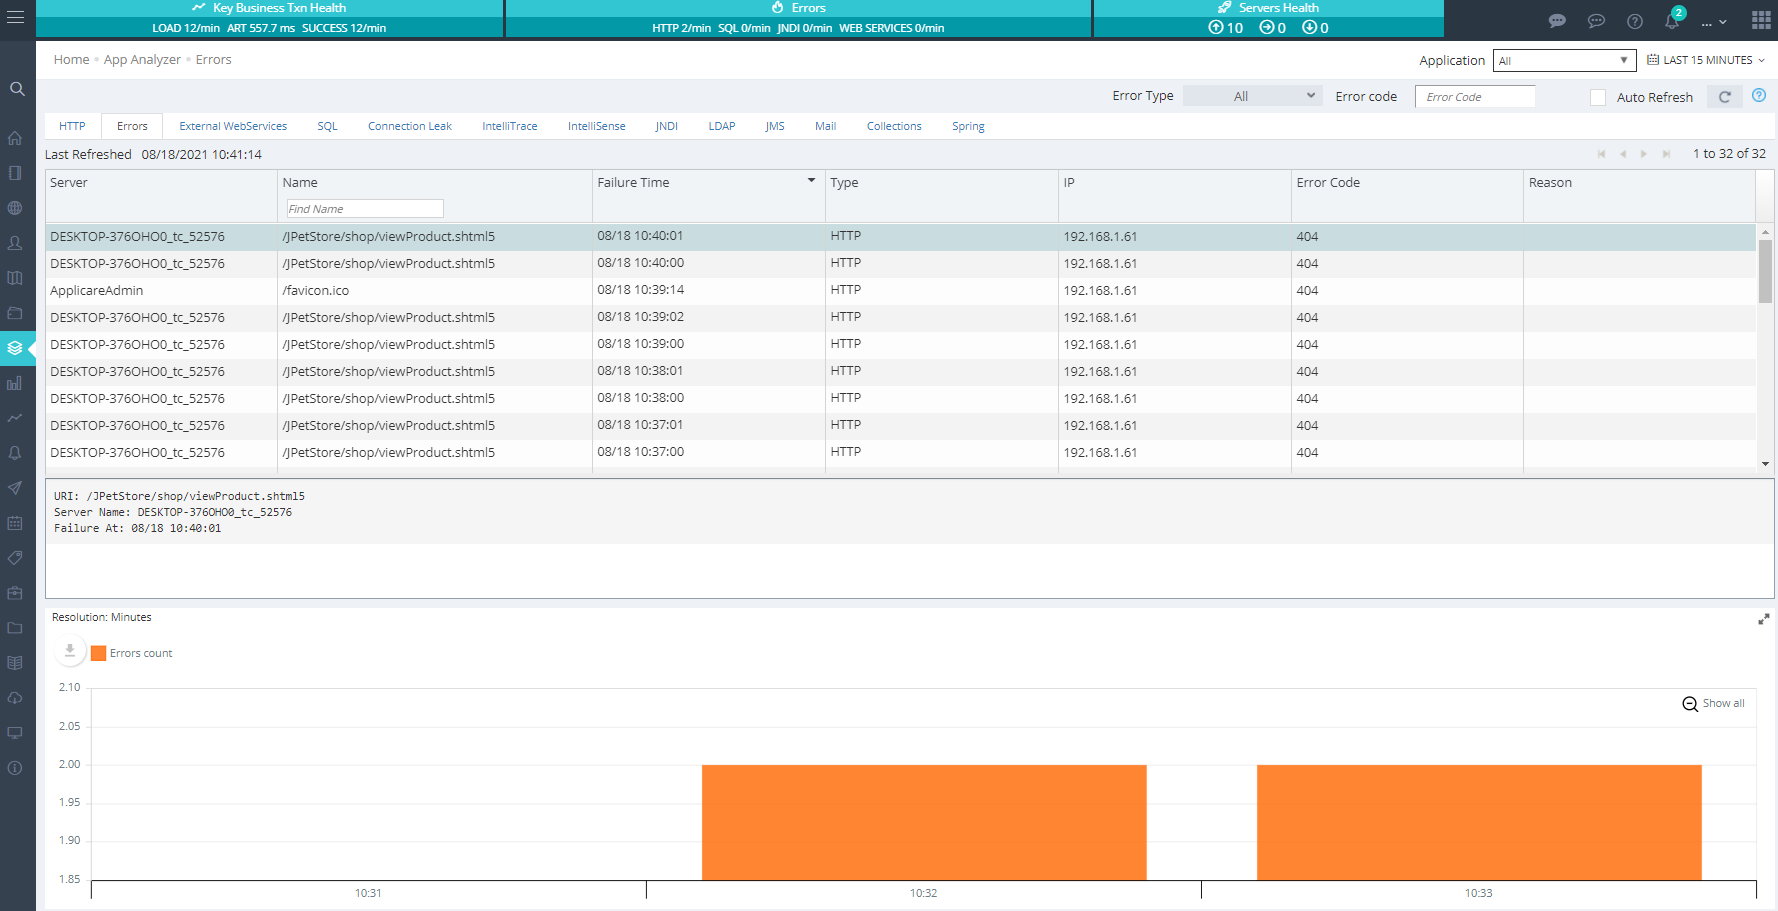
HTTP Errors
The HTTP Errors tab provides details of HTTP errors and allows drilling down into any specific http error. Details available for each http error are server name, URI, failure time, IP of the user who experienced the error, HTTP error code (404, 500 etc.) and HTTP exception details. Exception stack is available in the middle text box on selecting a transaction row in the table on top.
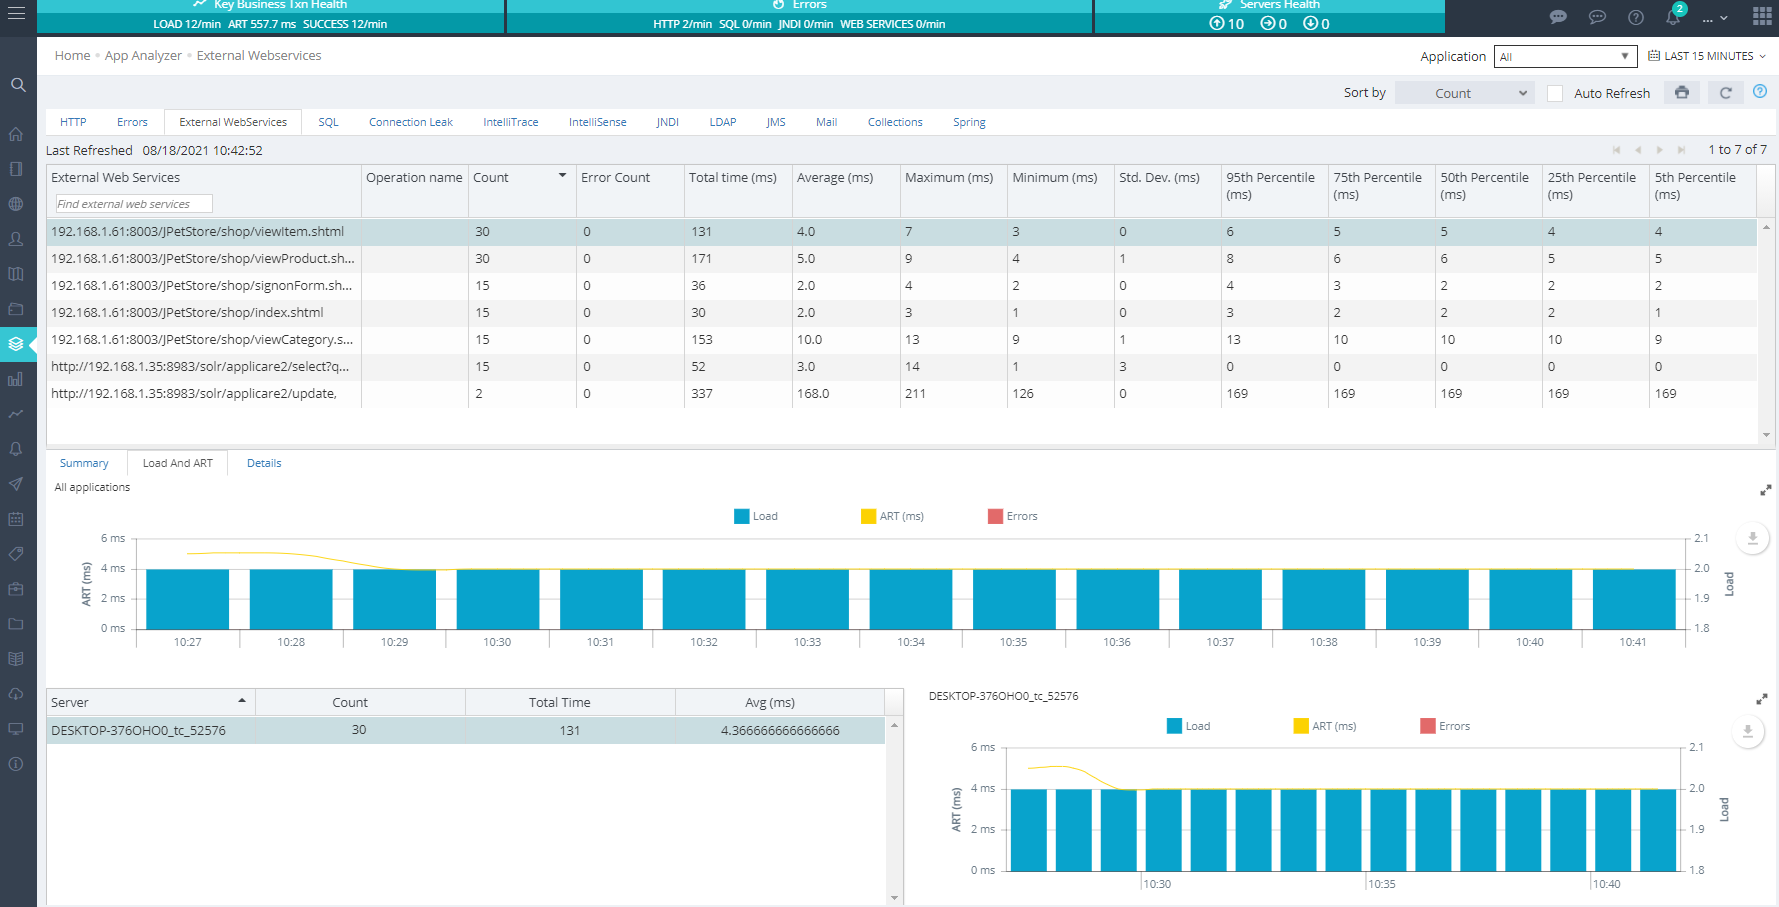
External WebServices
The External Web Services tab works very similar to HTTP tab, and provides performance data for external web service calls made from your application. Top table presents performance data in a tabular format, while the middle charts illustrate the performance of web services across all servers over time. Bottom left table shows performance on individual servers and bottom right chart either shows comparative performance or performance on an individual server if a server or row is selected in the bottom left table.
SQL
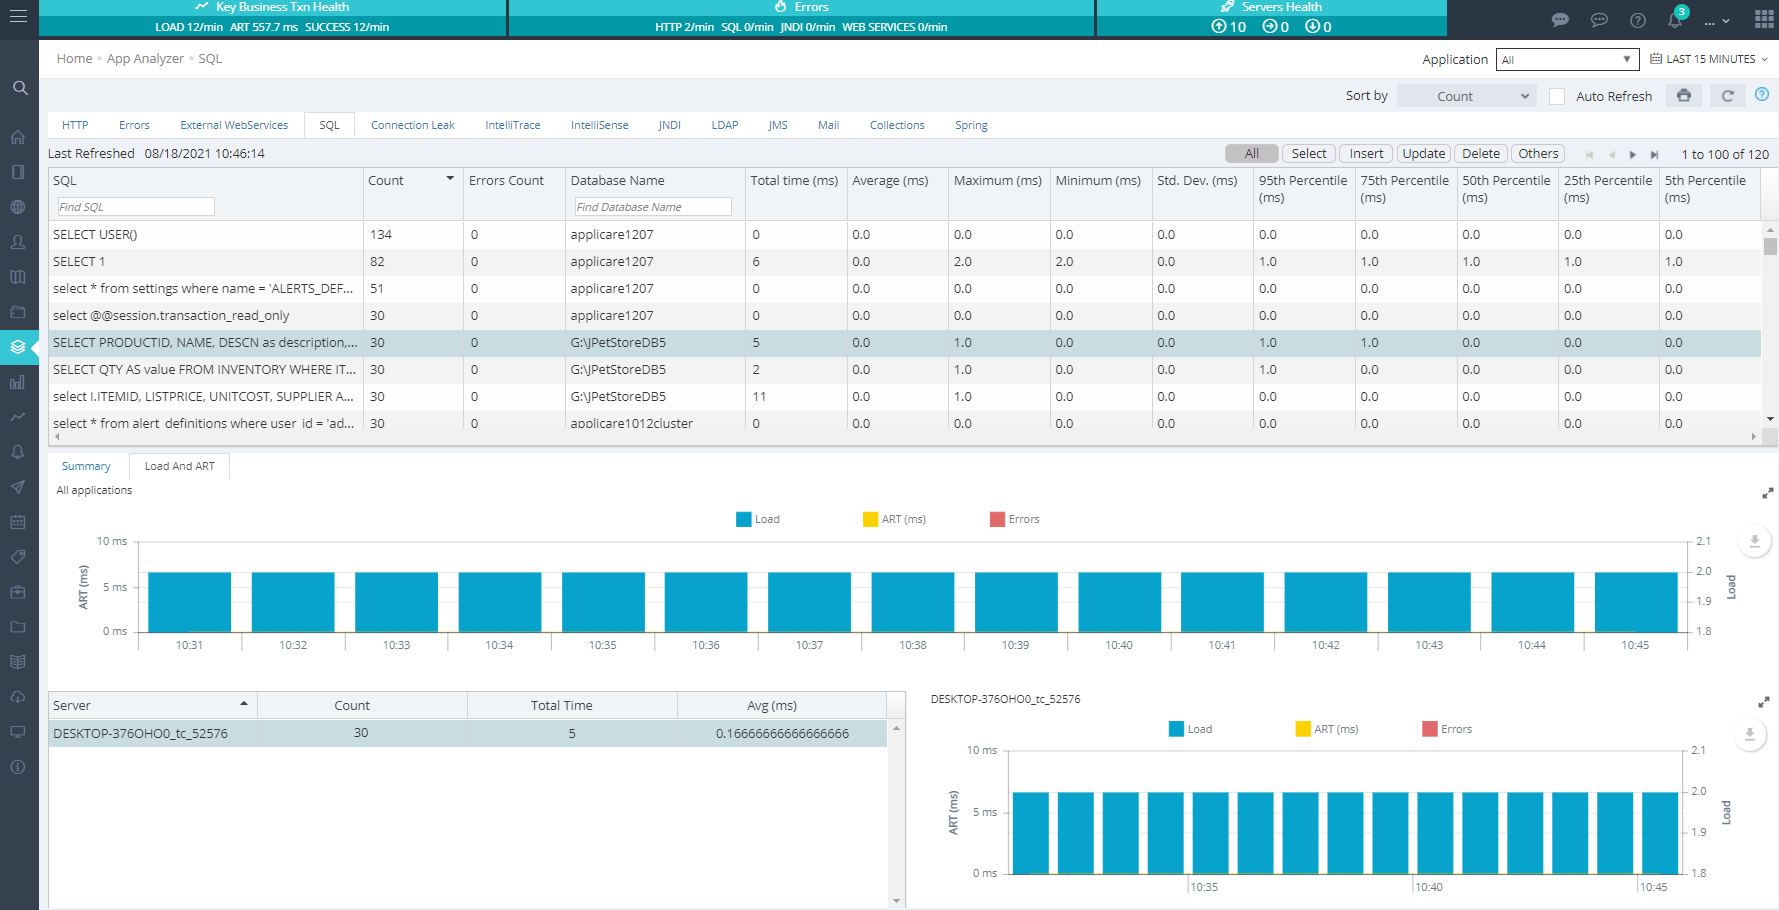
The SQL tab displays cumulative performance data for various SQL queries executed on the server within the app. Initially, a pie chart reveals the percentage of total time consumed by different SQL queries.
When you select a specific SQL query, the middle chart will present its cumulative performance across the application, while the bottom right chart provides a comparative view of performance across all servers. The bottom left section details performance on individual servers, allowing you to a server and view its performance in the bottom right chart.
Connection Leak
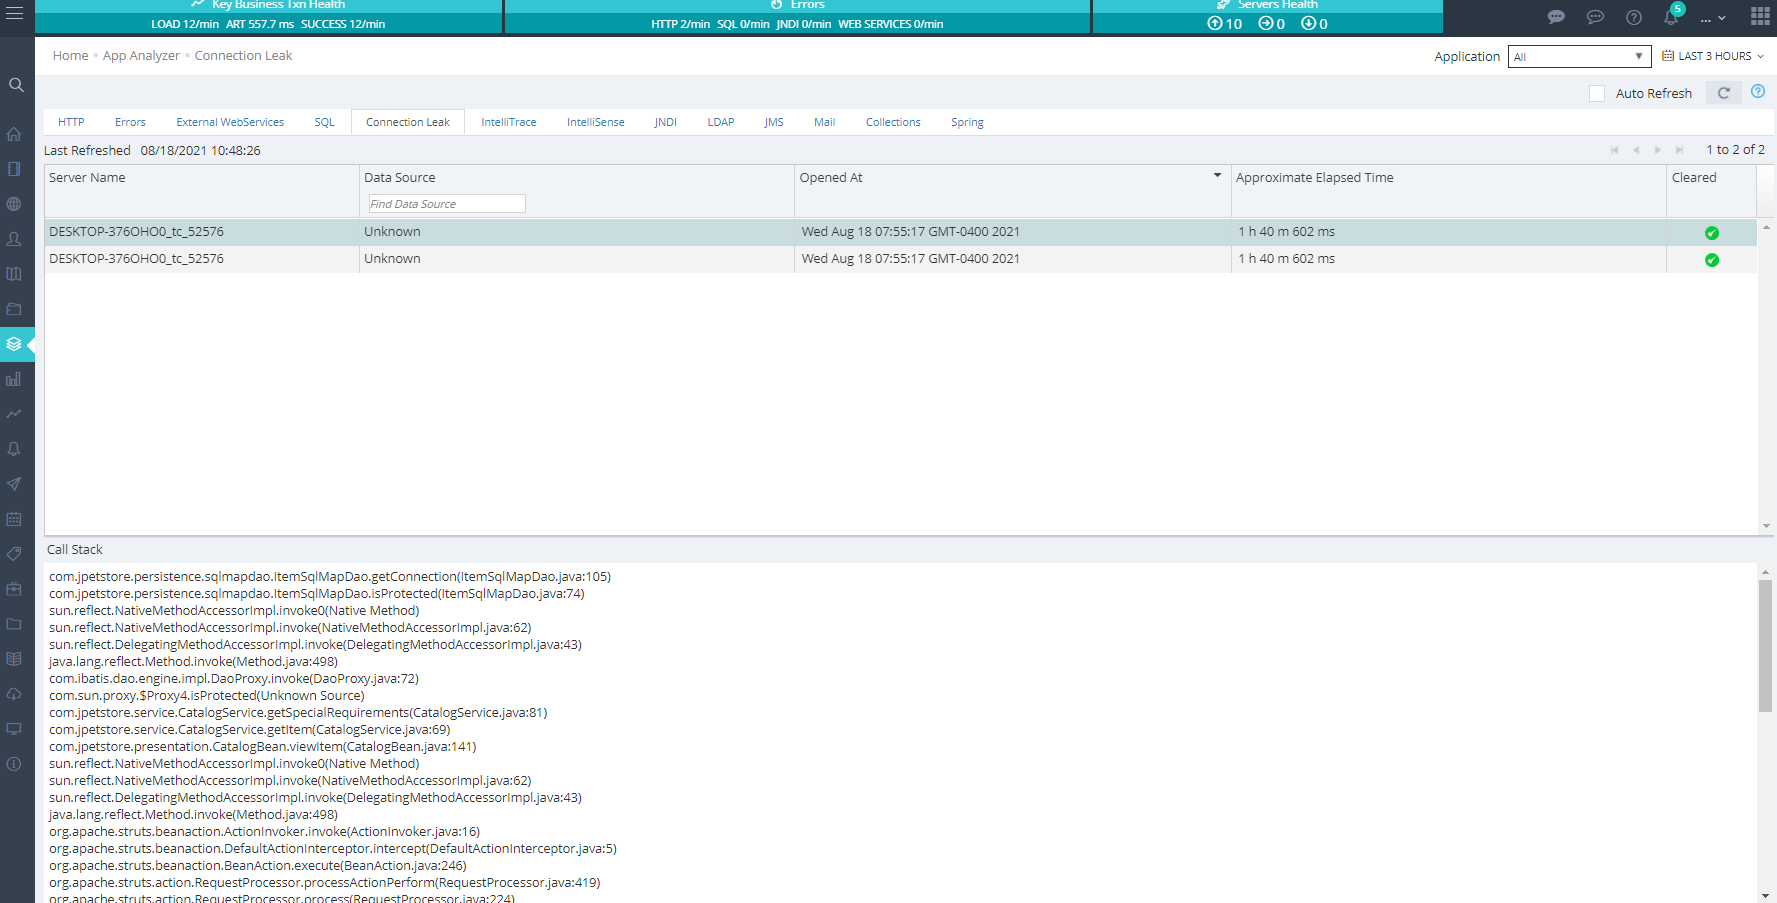
The Connection Leak tab shows detailed information about each connection leak, including the code responsible for the leak, the associated datasource, the time the connection was opened, and the duration for which it has been held.
IntelliTrace
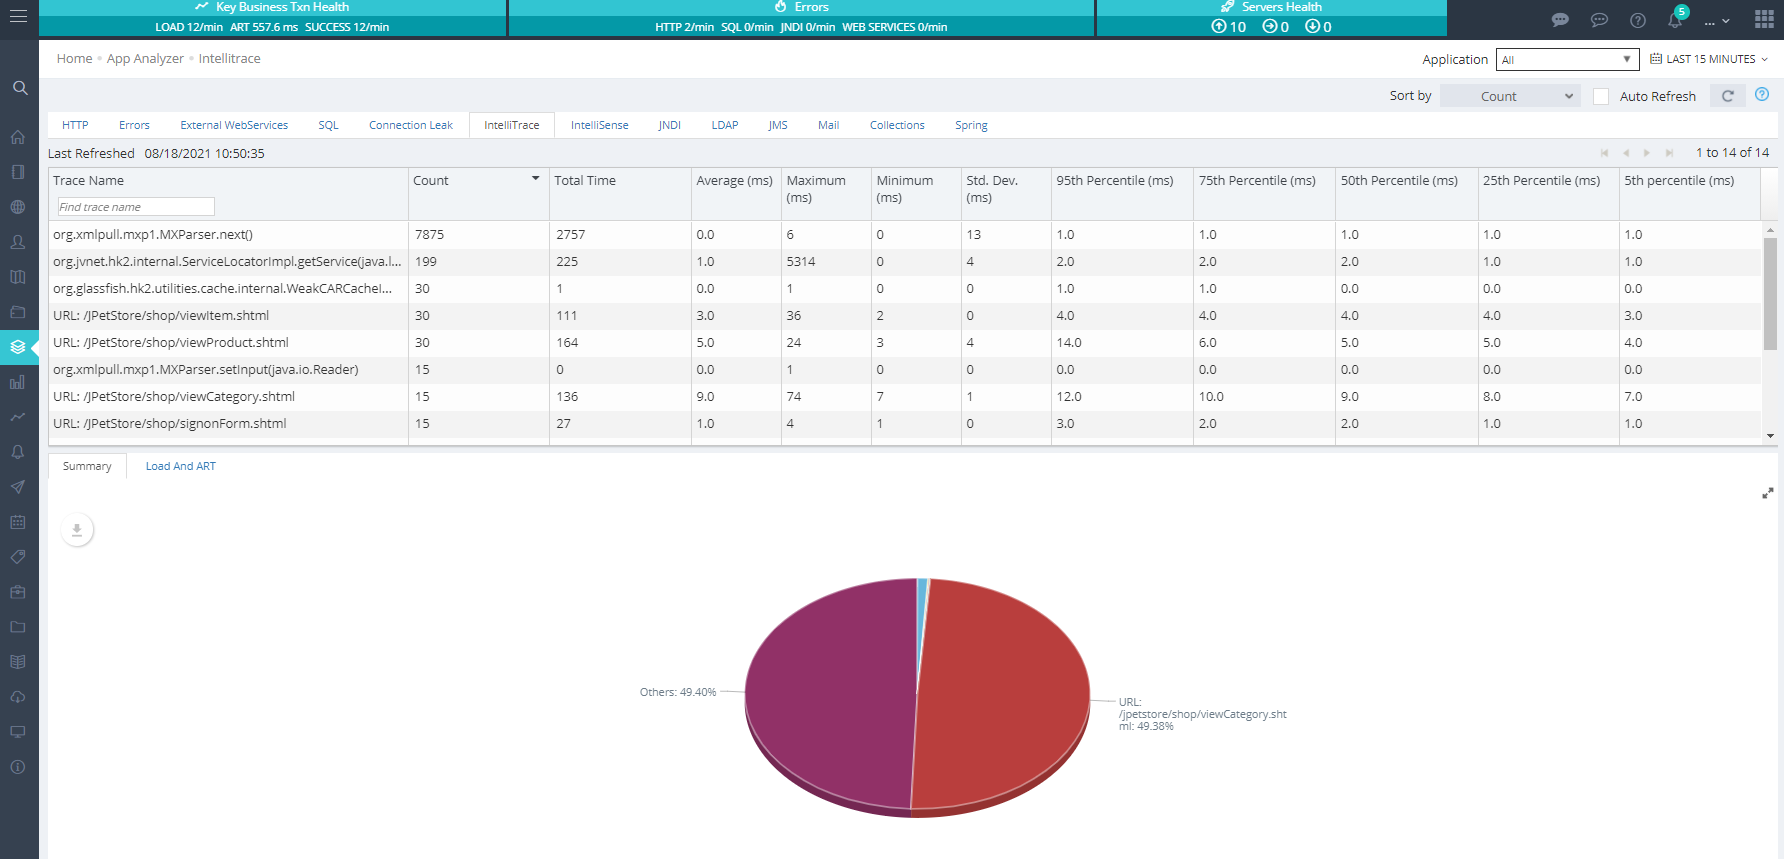
IntelliTrace tab shows various transactions including java, web sphere and HTTP calls flowing through the system. Bottom pie chart shows % based on total time consumed by a particular transaction and shows the impact of the transaction in grand schema of things.
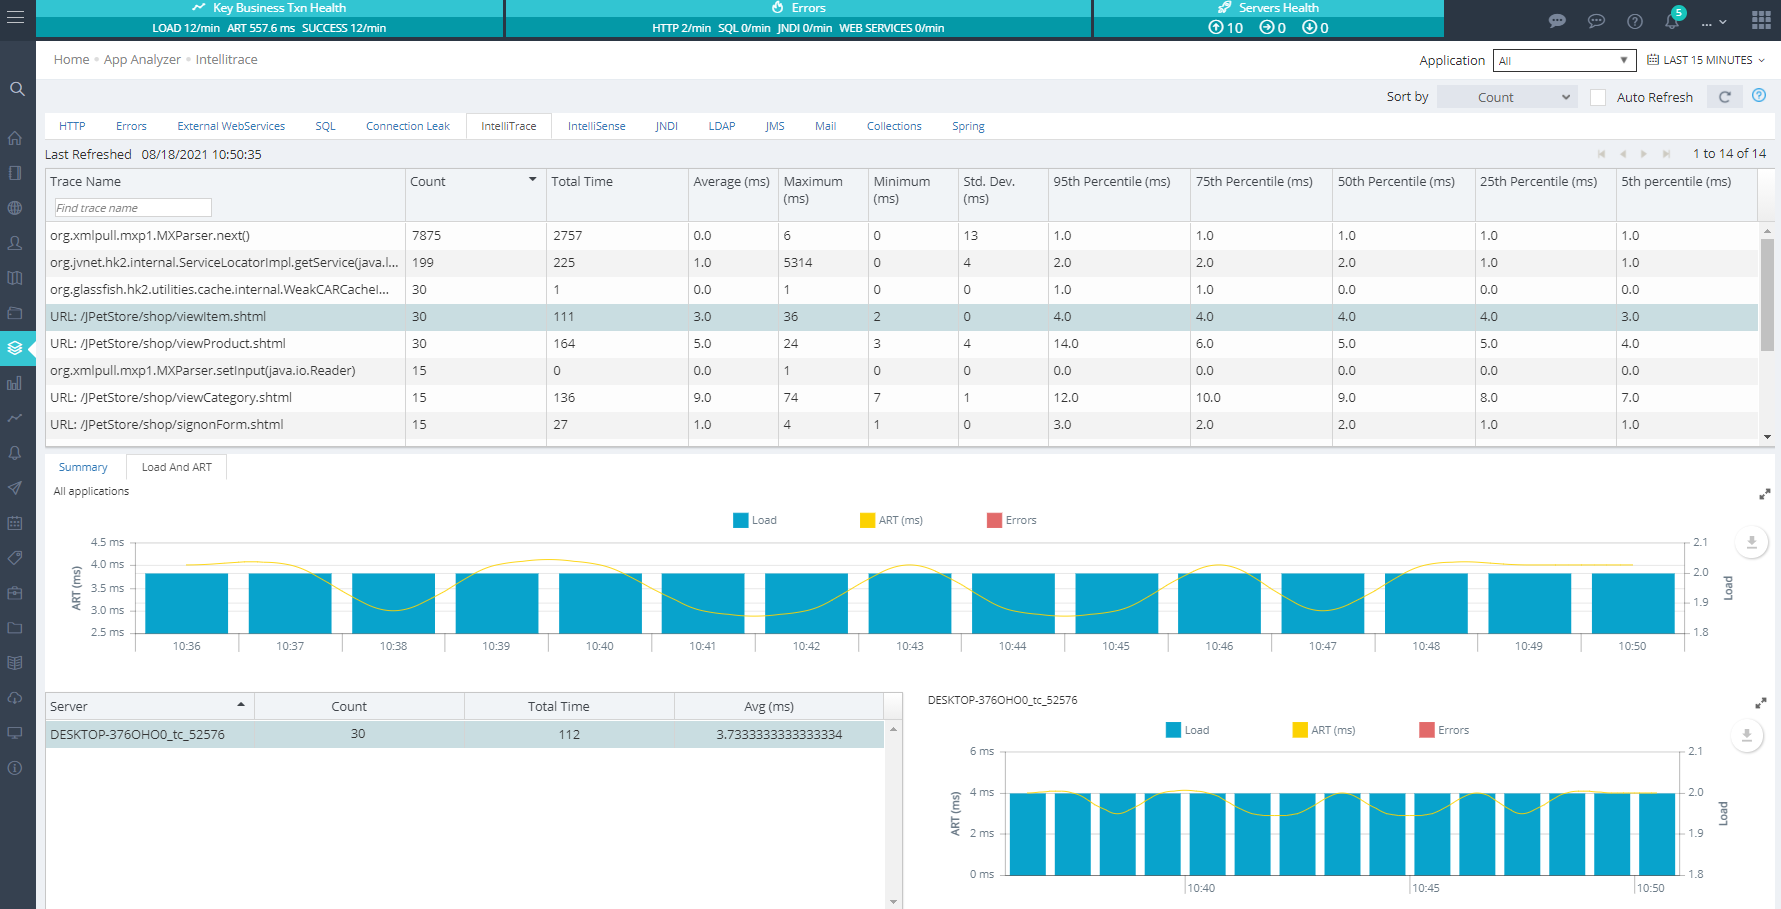
When you select a transaction in top table, the middle chart shows cumulative performance. Bottom left table shows transaction's performance across servers. Bottom right chart shows comparative performance or performance on a particular server if a sever row is selected in the table on the left.
IntelliSense
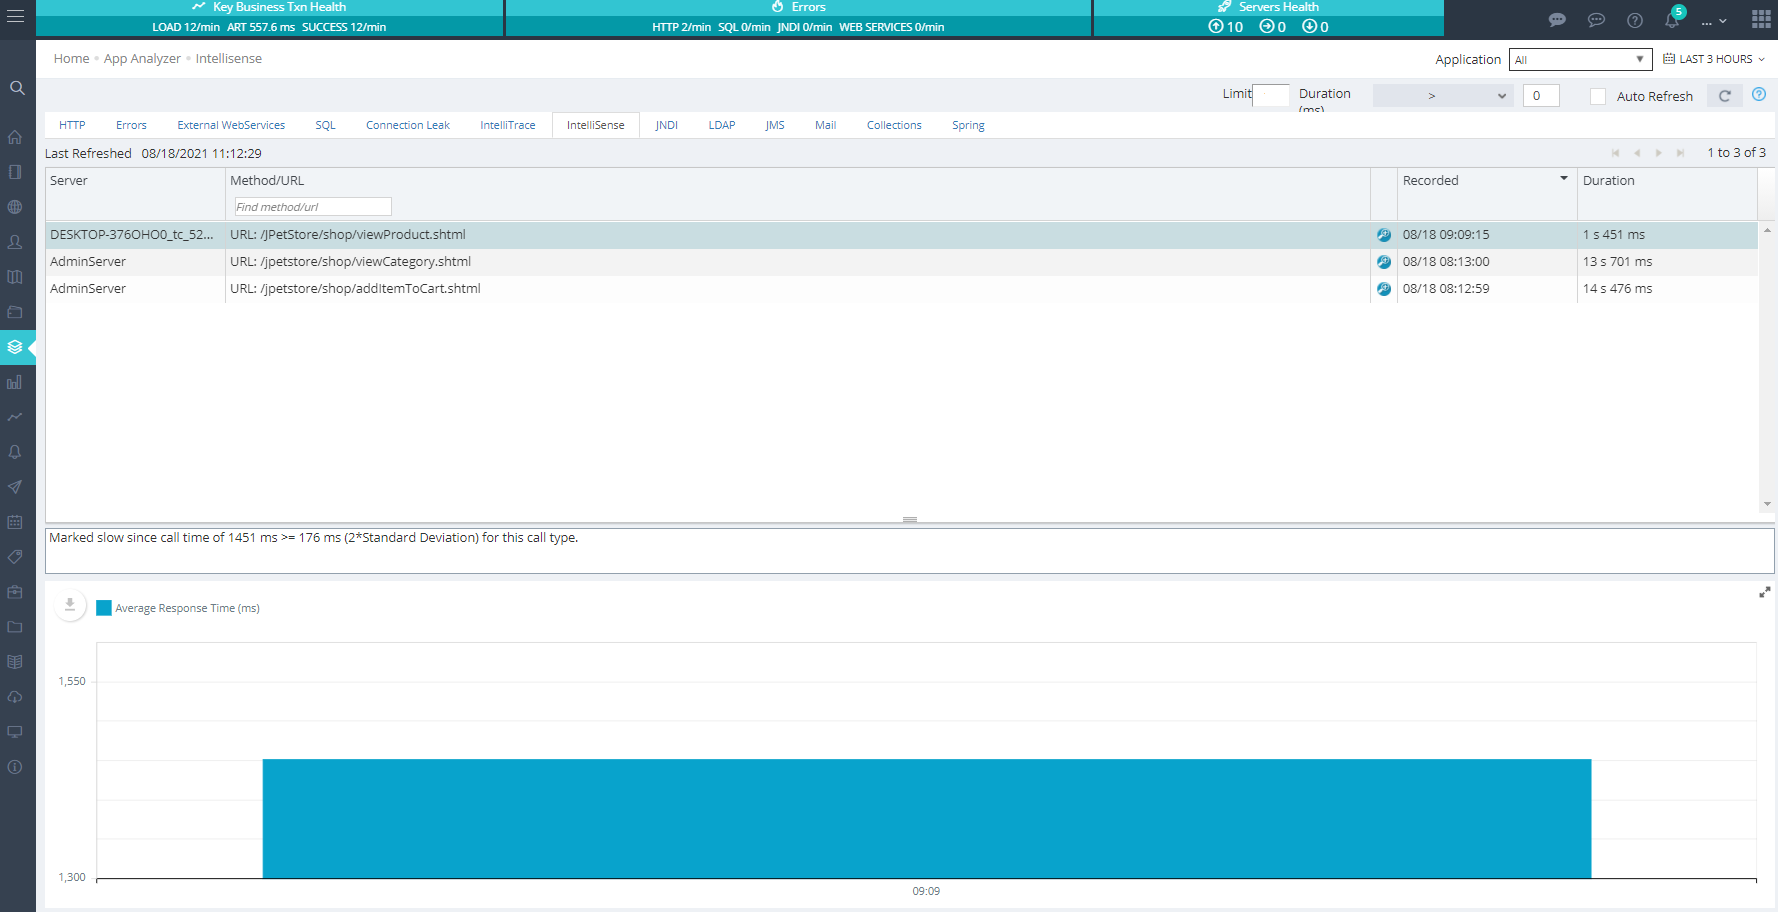
IntelliSense automatically collects in-depth performance data for transactions that exceeds predefined criteria such as those with duration more than a twice the standard deviation for the specified category call type. For detailed transaction performance stats, simply double-click the corresponding row.
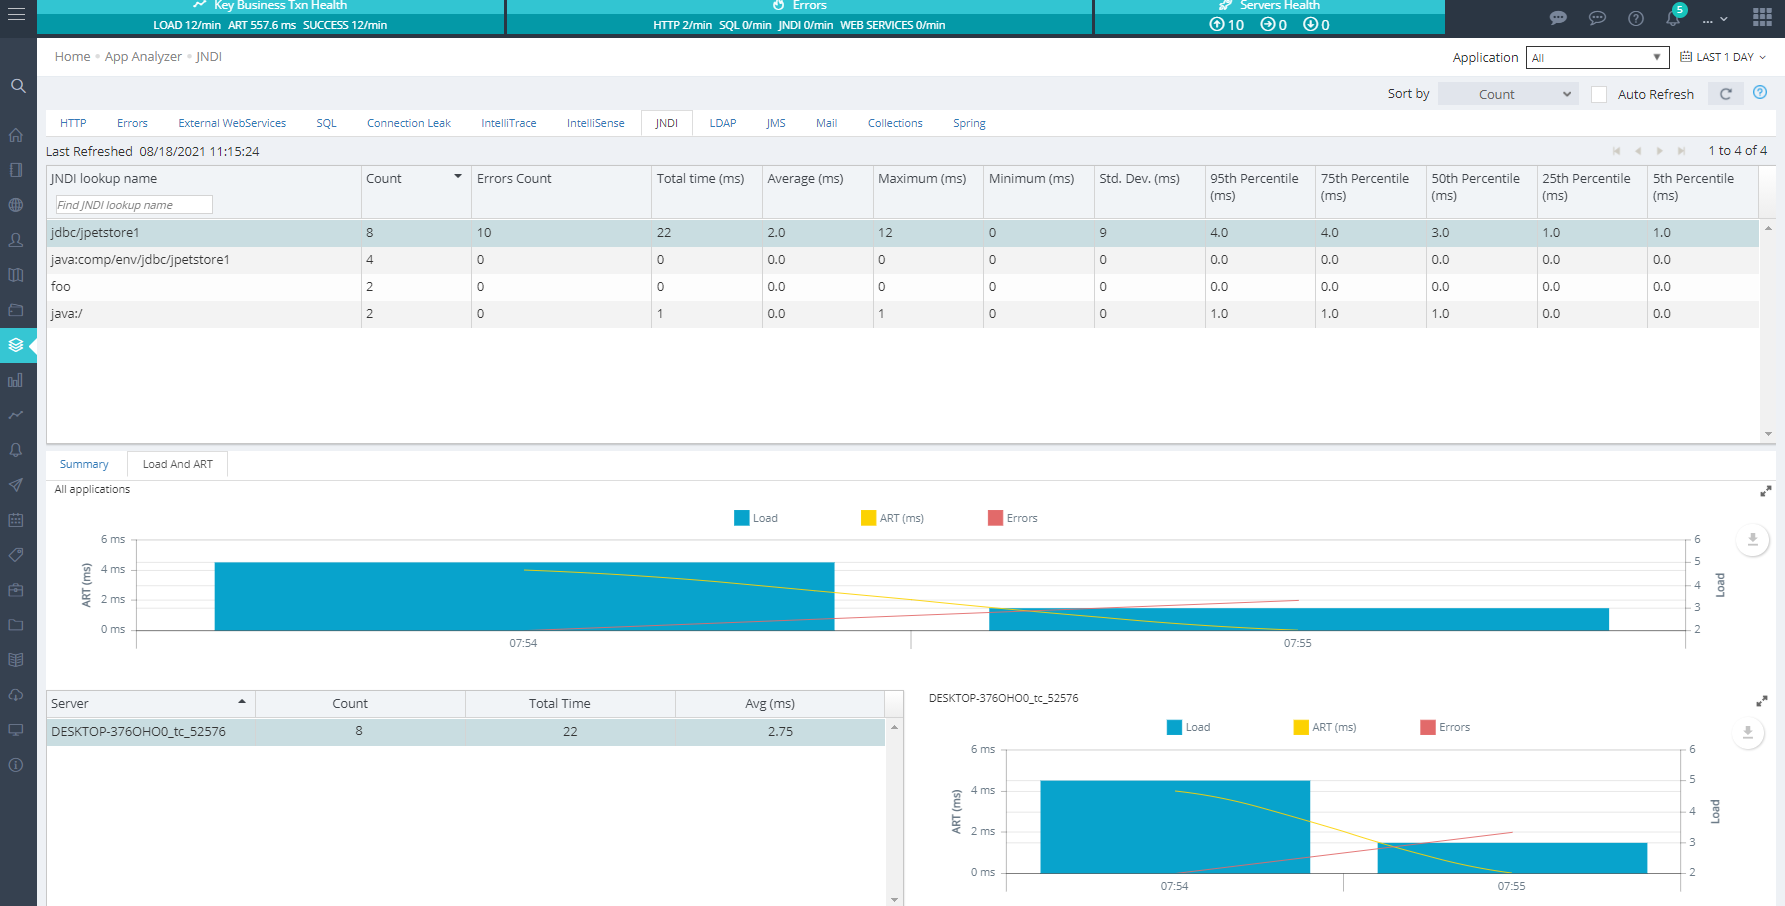
JNDI
The JNDI tab displays performance details for JNDI lookups. The initial view represent a pie chart with illustrating the percentage of time taken for these lookups.
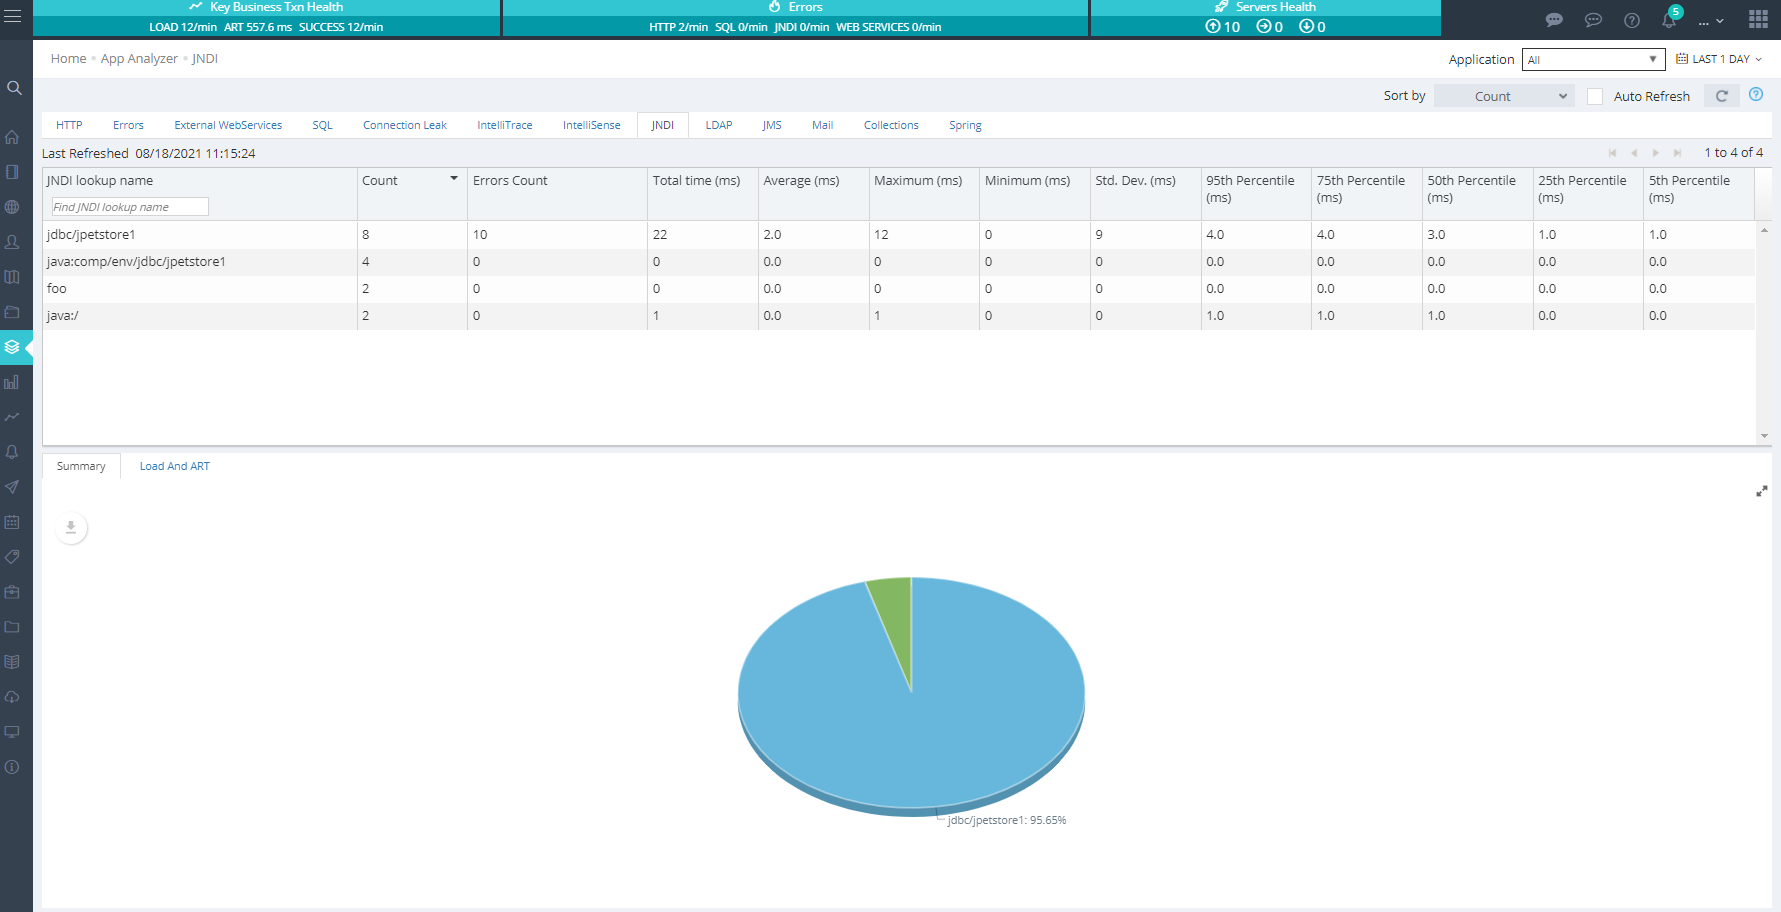
When you select a specific row, detailed information will be displayed in both the middle and bottom tables/charts.