To begin monitoring, Install the SingleAgent.
Once the SingleAgent installation is successfully completed, follow the subsequent steps below:
1. Open powershell in adminstrator mode and execute the following commands one by one.
$module_url = "https://github.com/open-telemetry/opentelemetry-dotnet-instrumentation/releases/latest/download/OpenTelemetry.DotNet.Auto.psm1"
$download_path = Join-Path $env:temp "OpenTelemetry.DotNet.Auto.psm1"
Invoke-WebRequest -Uri $module_url -OutFile $download_path -UseBasicParsing
Import-Module $download_path
Install-OpenTelemetryCore
Additional commands.
# List all available commands
Get-Command -Module OpenTelemetry.DotNet.Auto
To monitor Dotnet Applications hosted in IIS, execute the below command
Register-OpenTelemetryForIISAdd below environment variables to start monitor both .NET Framework and .NET Core applications.
COR_ENABLE_PROFILING=1
COR_PROFILER={918728DD-259F-4A6A-AC2B-B85E1B658318}
COR_PROFILER_PATH=C:\Program Files\OpenTelemetry .NET AutoInstrumentation\win-x64\OpenTelemetry.AutoInstrumentation.Native.dll
CORECLR_ENABLE_PROFILING=1
CORECLR_PROFILER={918728DD-259F-4A6A-AC2B-B85E1B658318}
CORECLR_PROFILER_PATH=C:\Program Files\OpenTelemetry .NET AutoInstrumentation\win-x64\OpenTelemetry.AutoInstrumentation.Native.dll
DOTNET_ADDITIONAL_DEPS=C:\Program Files\OpenTelemetry .NET AutoInstrumentation\AdditionalDeps
DOTNET_SHARED_STORE=C:\Program Files\OpenTelemetry .NET AutoInstrumentation\store
DOTNET_STARTUP_HOOKS=C:\Program Files\OpenTelemetry .NET AutoInstrumentation\net\OpenTelemetry.AutoInstrumentation.StartupHook.dll
OTEL_DOTNET_AUTO_HOME=C:\Program Files\OpenTelemetry .NET AutoInstrumentation
OTEL_DOTNET_AUTO_INSTALL_DIR=C:\Program Files\OpenTelemetry .NET AutoInstrumentation
OTEL_DOTNET_AUTO_LOGS_CONSOLE_EXPORTER_ENABLED=true
OTEL_DOTNET_AUTO_METRICS_CONSOLE_EXPORTER_ENABLED=true
OTEL_DOTNET_AUTO_TRACES_CONSOLE_EXPORTER_ENABLED=true
OTEL_DOTNET_AUTO_ENTITYFRAMEWORKCORE_SET_DBSTATEMENT_FOR_TEXT=true
OTEL_DOTNET_AUTO_SQLCLIENT_SET_DBSTATEMENT_FOR_TEXT=true
OTEL_EXPORTER_OTLP_ENDPOINT=http://localhost:4418
OTEL_SERVICE_NAME=<APPLICARE_AGENT_NAME>
Note:
<APPLICARE_AGENT_NAME>: Provide a unique, descriptive name that will help you identify this specific container or application within the Applicare monitoring console.
After the above settings restart the .NET application or IIS.
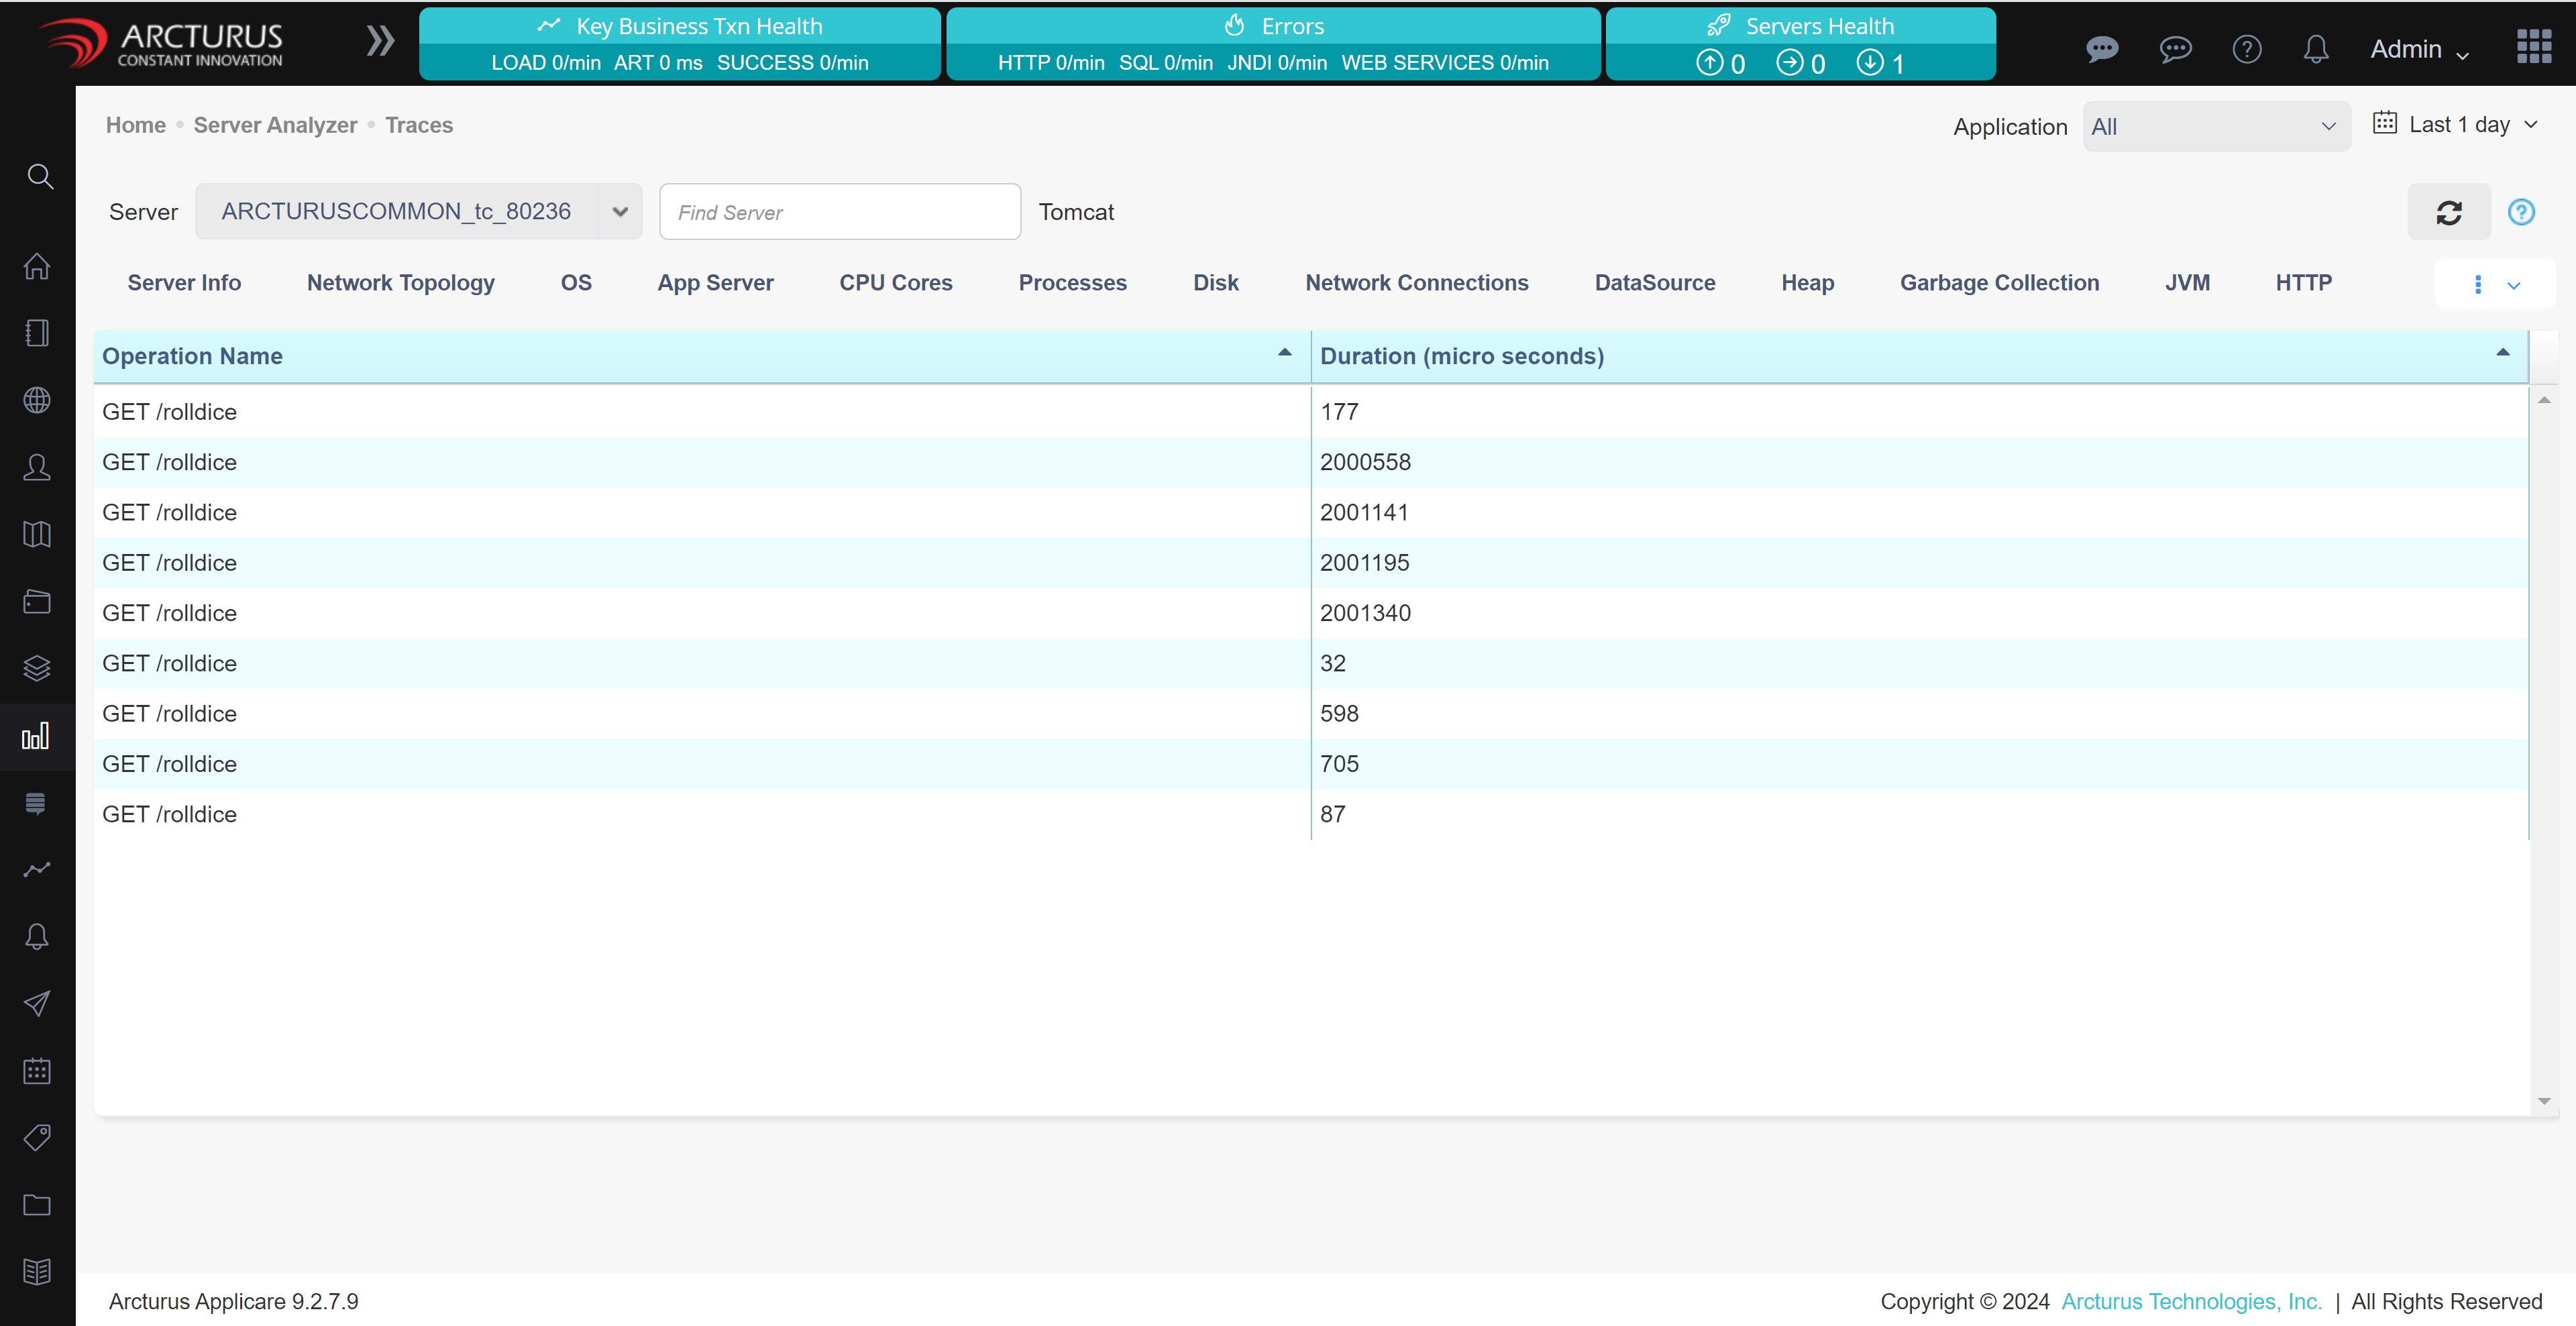
The collected traces will be shown in Server Analyzer -> Telemetry Traces screen in Applicare console.