Step 1: Run kubectl top nodes in your Kubernetes environment. If you do not see the details as expected, proceed to Step 2 if the information is displayed correctly, move on to Step 3.

Step 2: Install the metrics server in your Kubernetes cluster. Execute the following command to deploy the metrics pod.
kubectl apply -f https://github.com/kubernetes-sigs/metrics-server/releases/latest/download/components.yaml
Check if the metrics server is running by executing the following command.
kubectl get pods -n kube-system
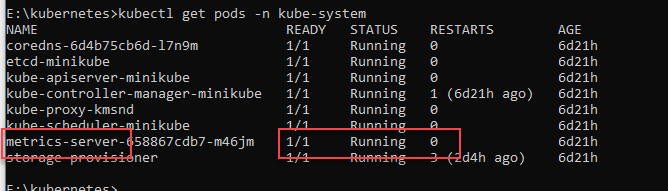
If the metrics server is running, proceed to step 3. If it is not running, follow the steps below
1: Edit the configuration file by running the following command.
kubectl edit deployments.apps -n kube-system metrics-server2: Add the following lines under in the spec: container: args: in the configuration file and save your changes.
- --kubelet-insecure-tls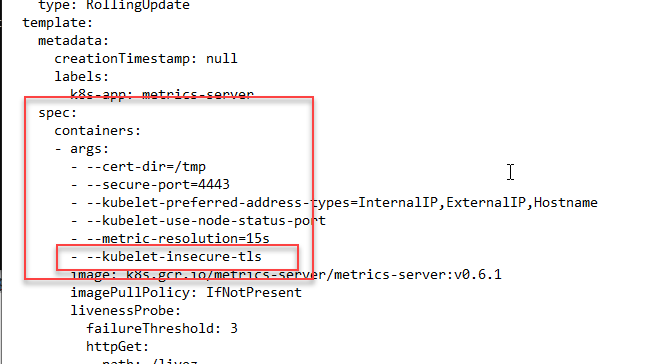
3: After a few minutes, run the command kubectl get pods -n kube-system to check if the metrics server is running. If it is, running skip the following step.
4: Edit the configuration file by running the command kubectl edit deployments.apps -n kube-system metrics-server update the lines under spec: container: args: and save your changes.
- --kubelet-preferred-address-types=InternalIP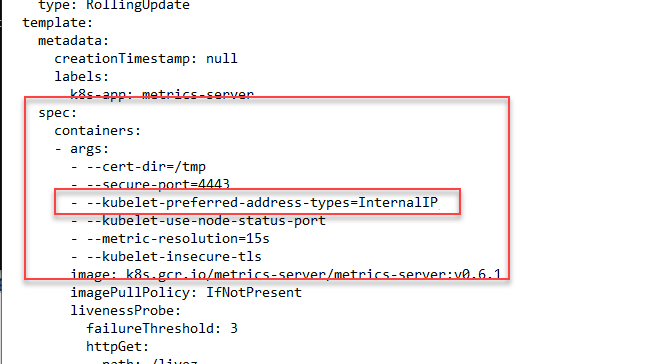
5: To verify that the metrics API server is running, execute the following command and review the output:
kubectl top nodes

SingleAgent should be deployed in the machine where Kubernetes cluster is running.
Step 3: Refer here to install SingleAgent and start.
Once the agent is started, it will automatically be added to the Applicare Console.
Step 4. Run the following command and record the cluster server details for configuration.
kubectl config view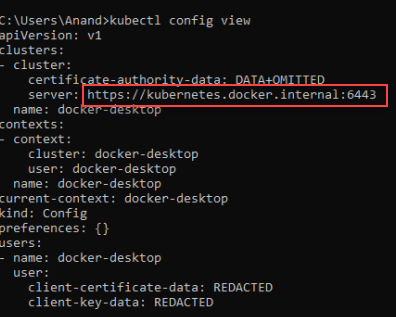
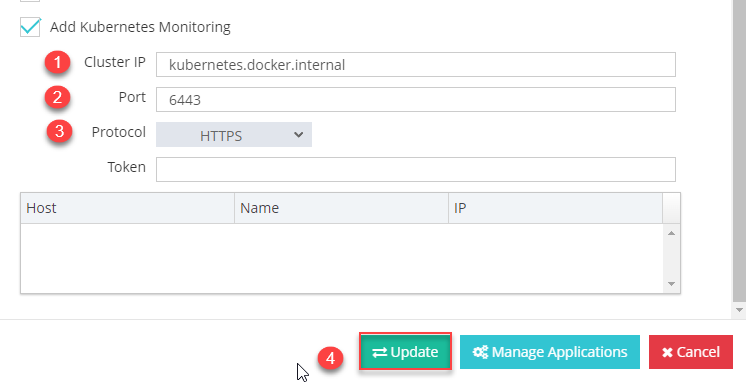
Cluster IP : kubernetes.docker.internal
Port : 6443
Protocol : https
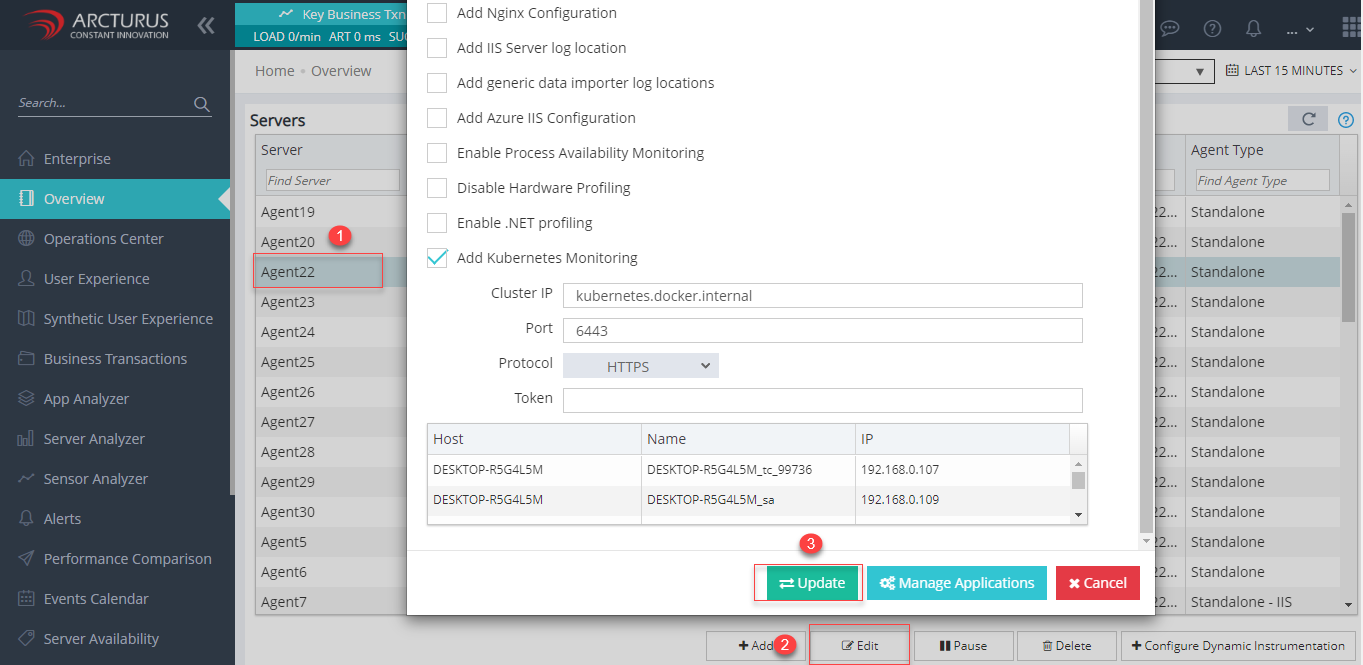
Step 5: Log in to Applicare Console and navigate to the Overview screen, select the newly added server and click Edit button.
Step 6: Enable the Add Kubernetes Monitoring checkbox and enter the configuration details. Leave the Token field empty and click the update button.
We can edit or delete the kubernetes configuration from both the Overview or Kubernetes menu.
Overview Menu
Update
Select the row and click Edit button and update the details and click Update button.
Delete
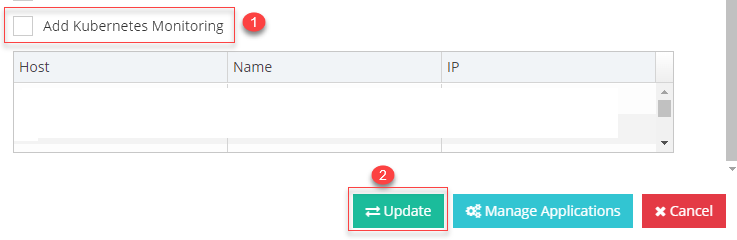
Select the row and click Edit button and uncheck the Add the Kubernetes Monitoring checkbox and click Update button.
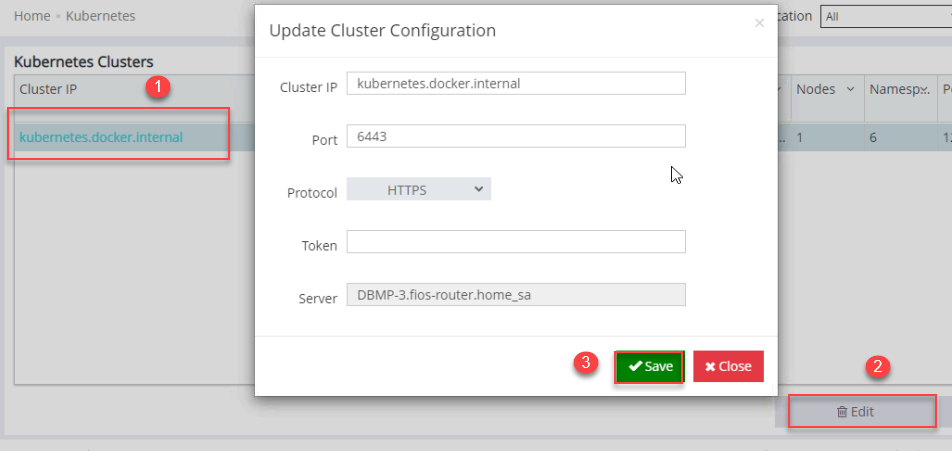
Kubernetes Menu
Update
Select the row and click Edit button and update the details and click Save button.
Delete
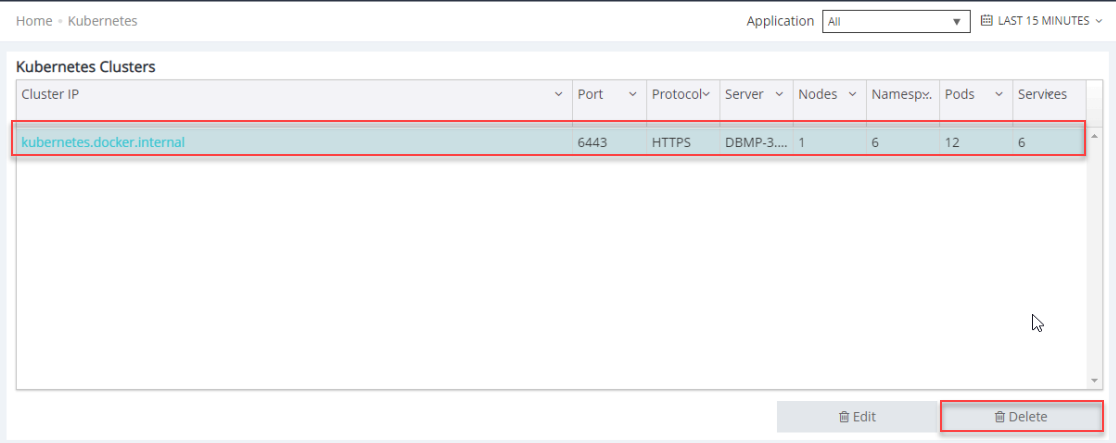
Select the row and click Delete button.