PHP Application Monitoring

Check this against your version

This article was last updated on Apr 1, 2025, before Applicare 10.0 was released (Jun 19, 2026), and has not been re-checked for Applicare 10.0. Confirm the steps in your environment or contact Support.

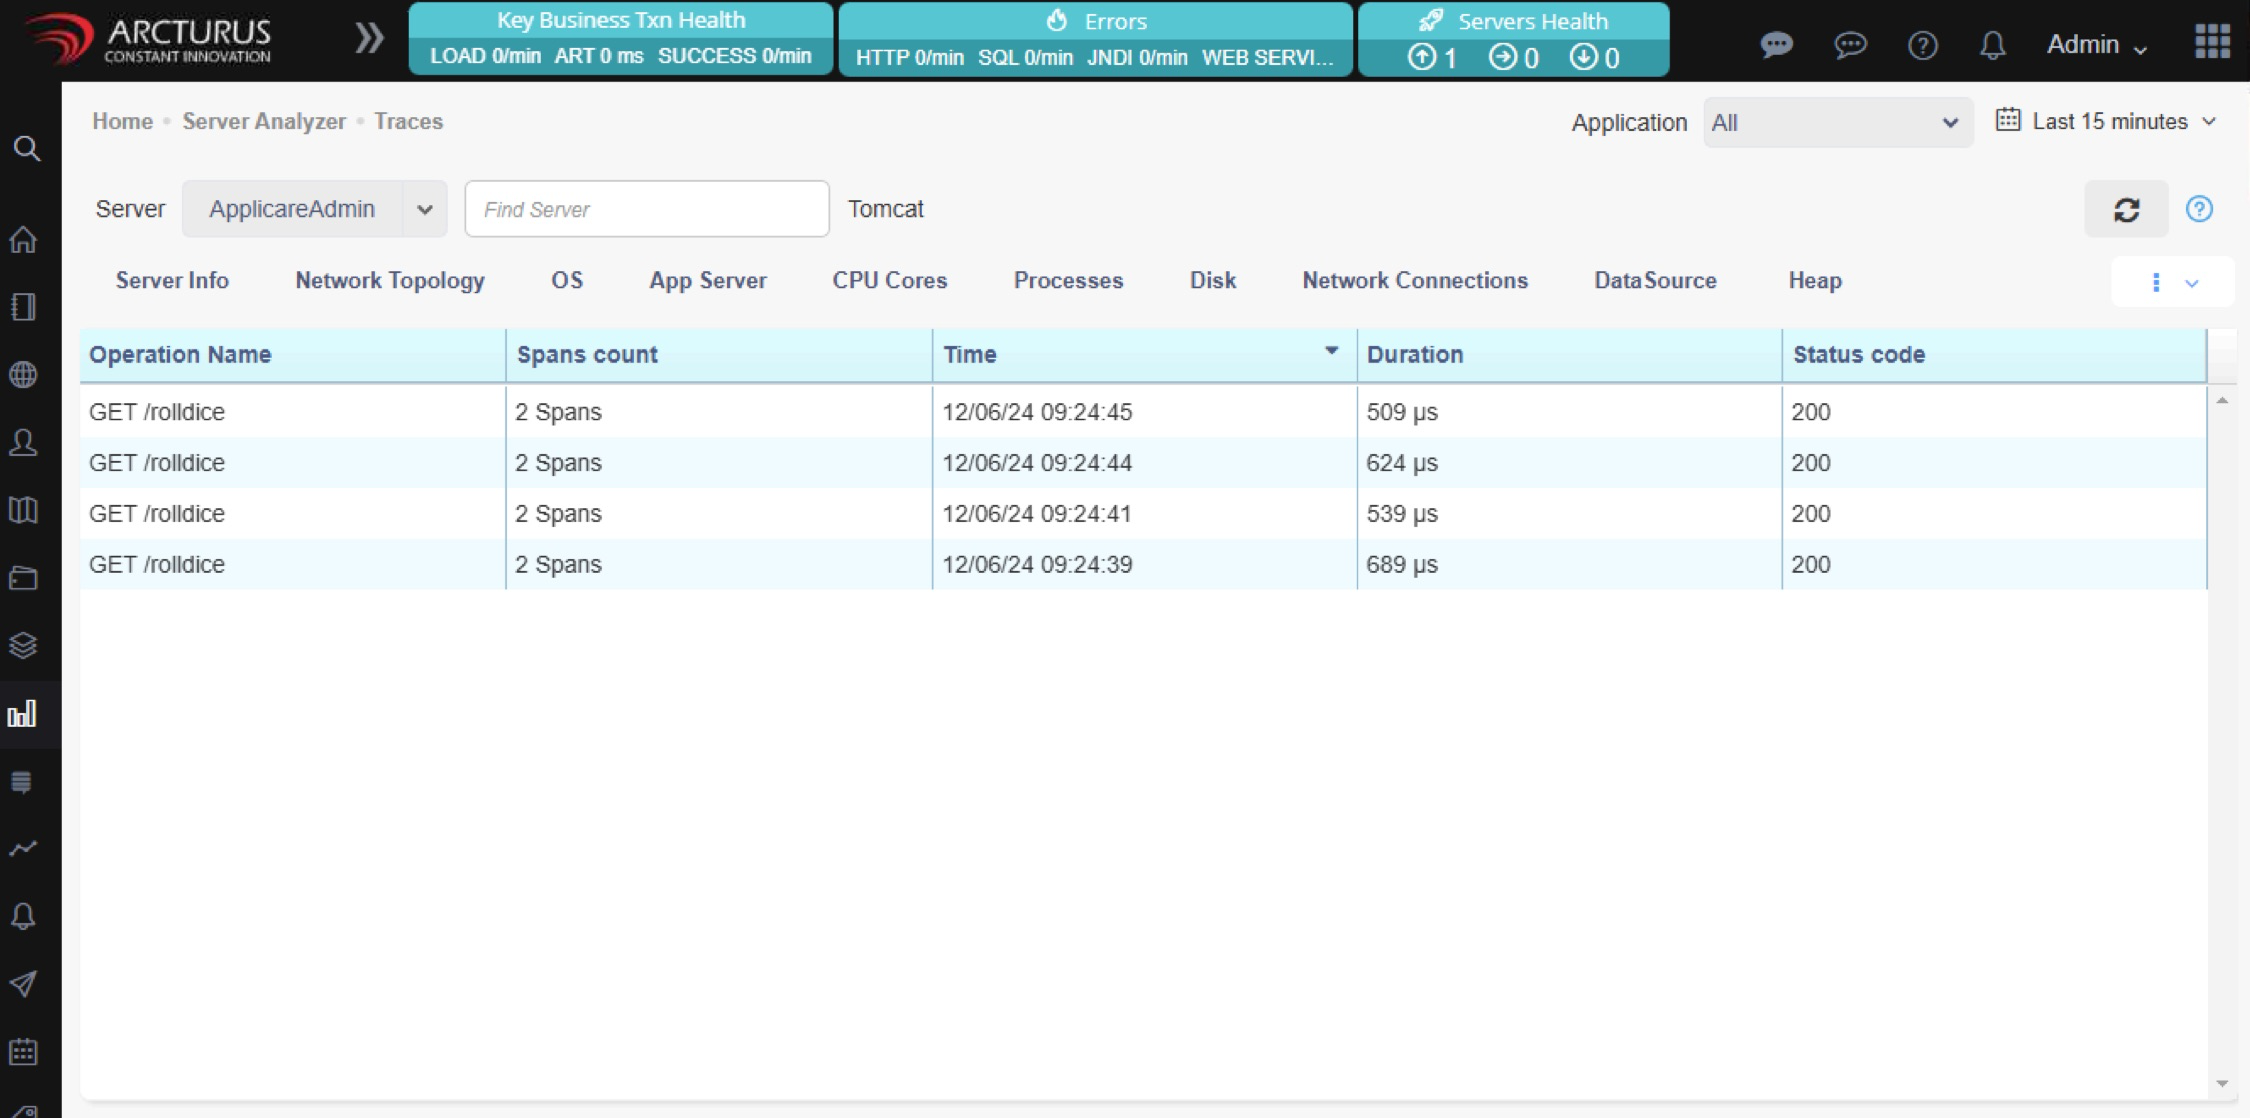
Log in to Applicare controller and navigate to the Server Analyzer->Telemetry Traces menu to view the details of PHP application transaction.

1. The screen displays a list of PHP applications transactions, including their durations and status codes.

Screenshot 1 — PHP Application Monitoring

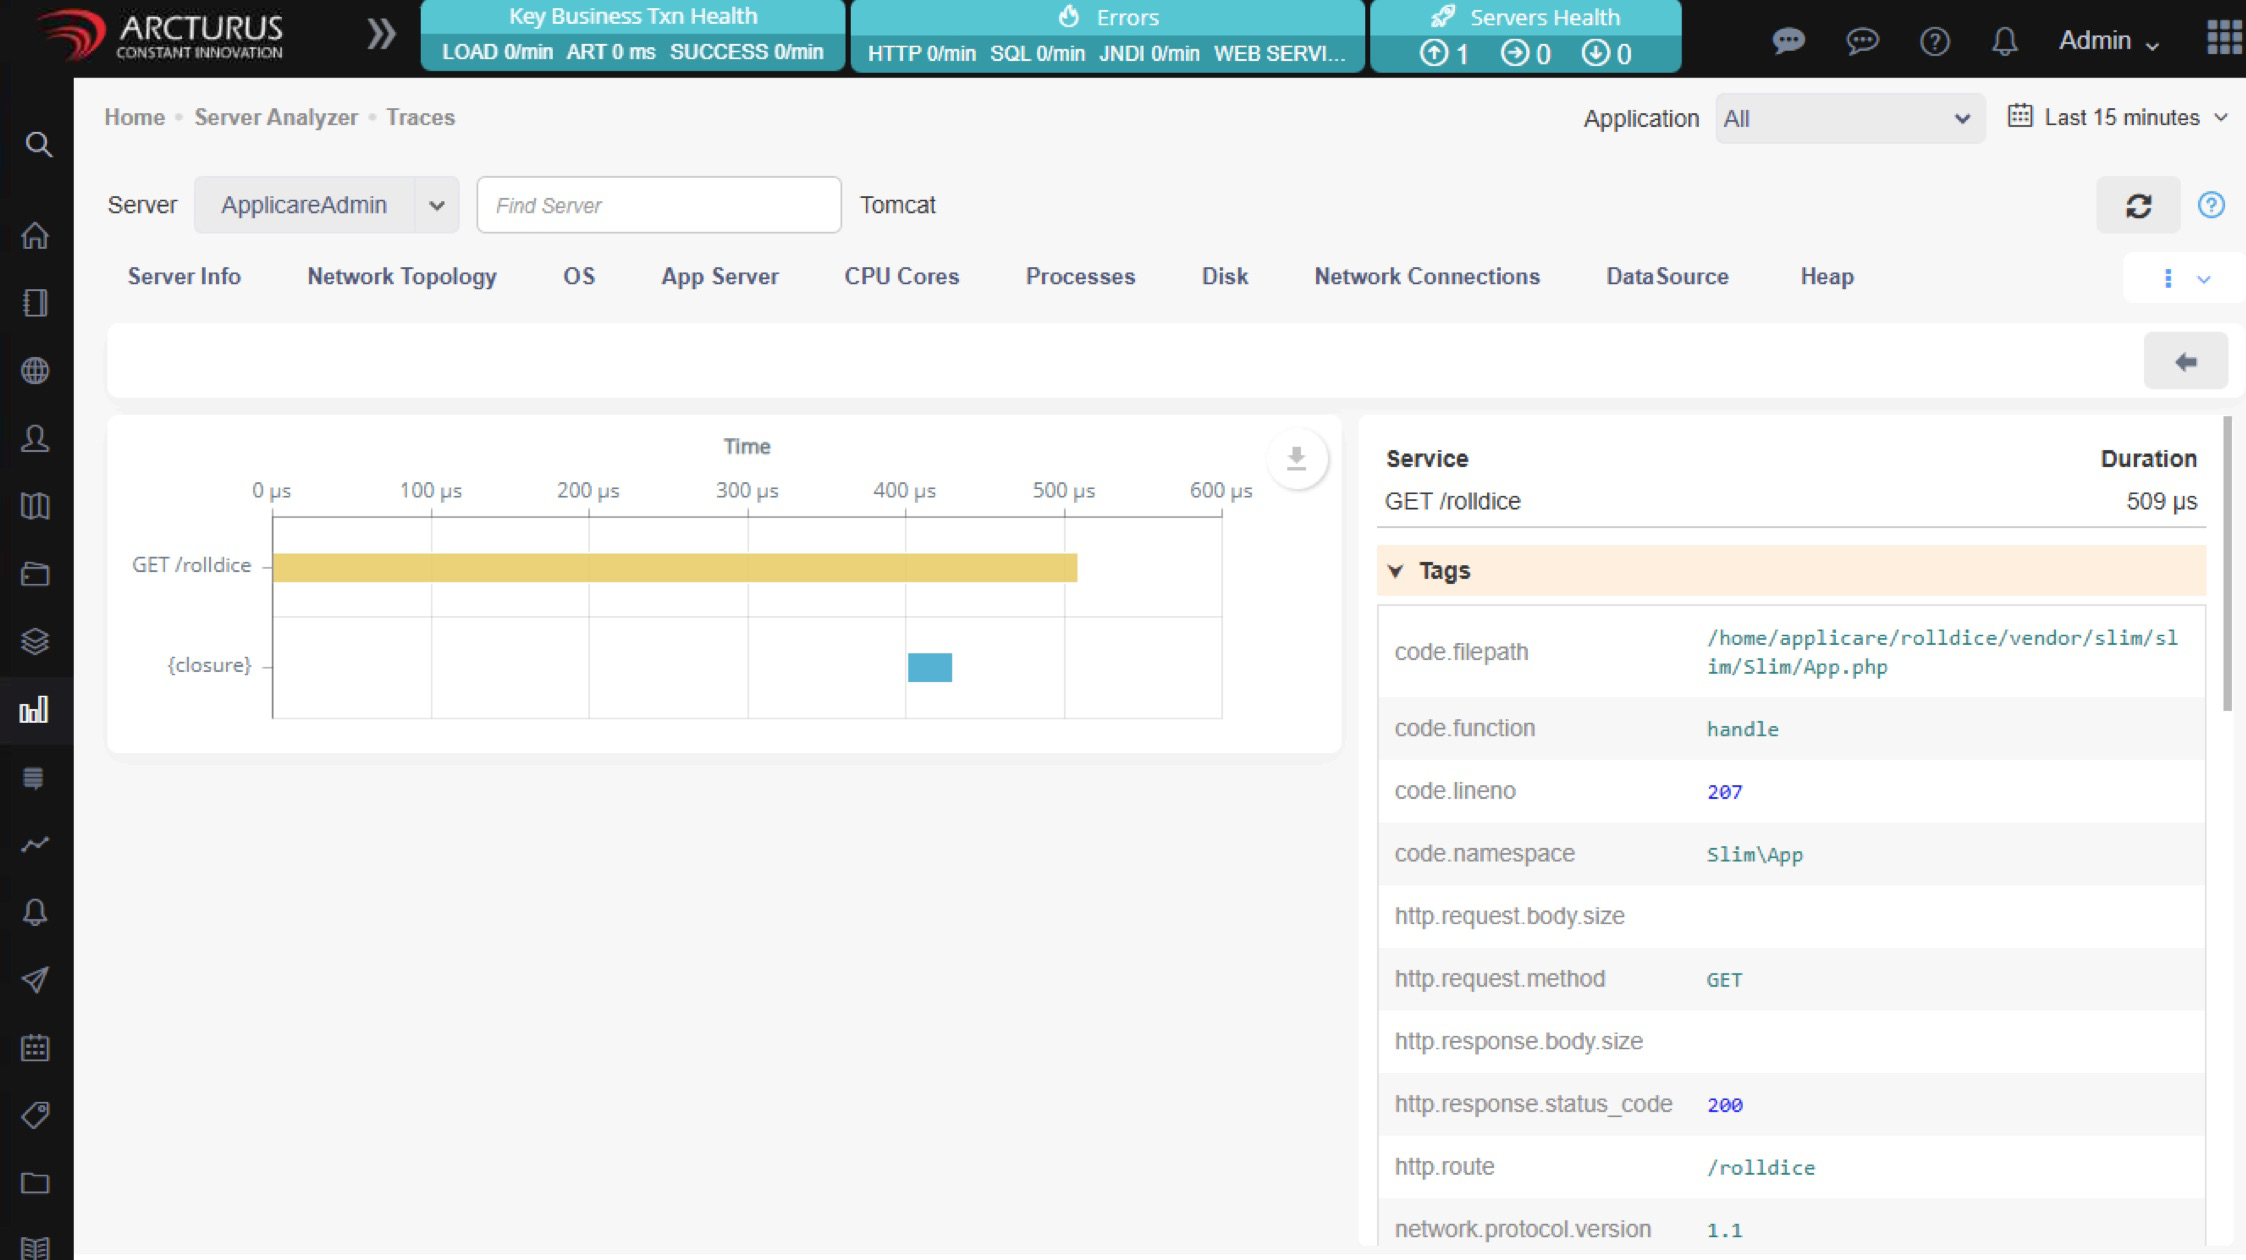
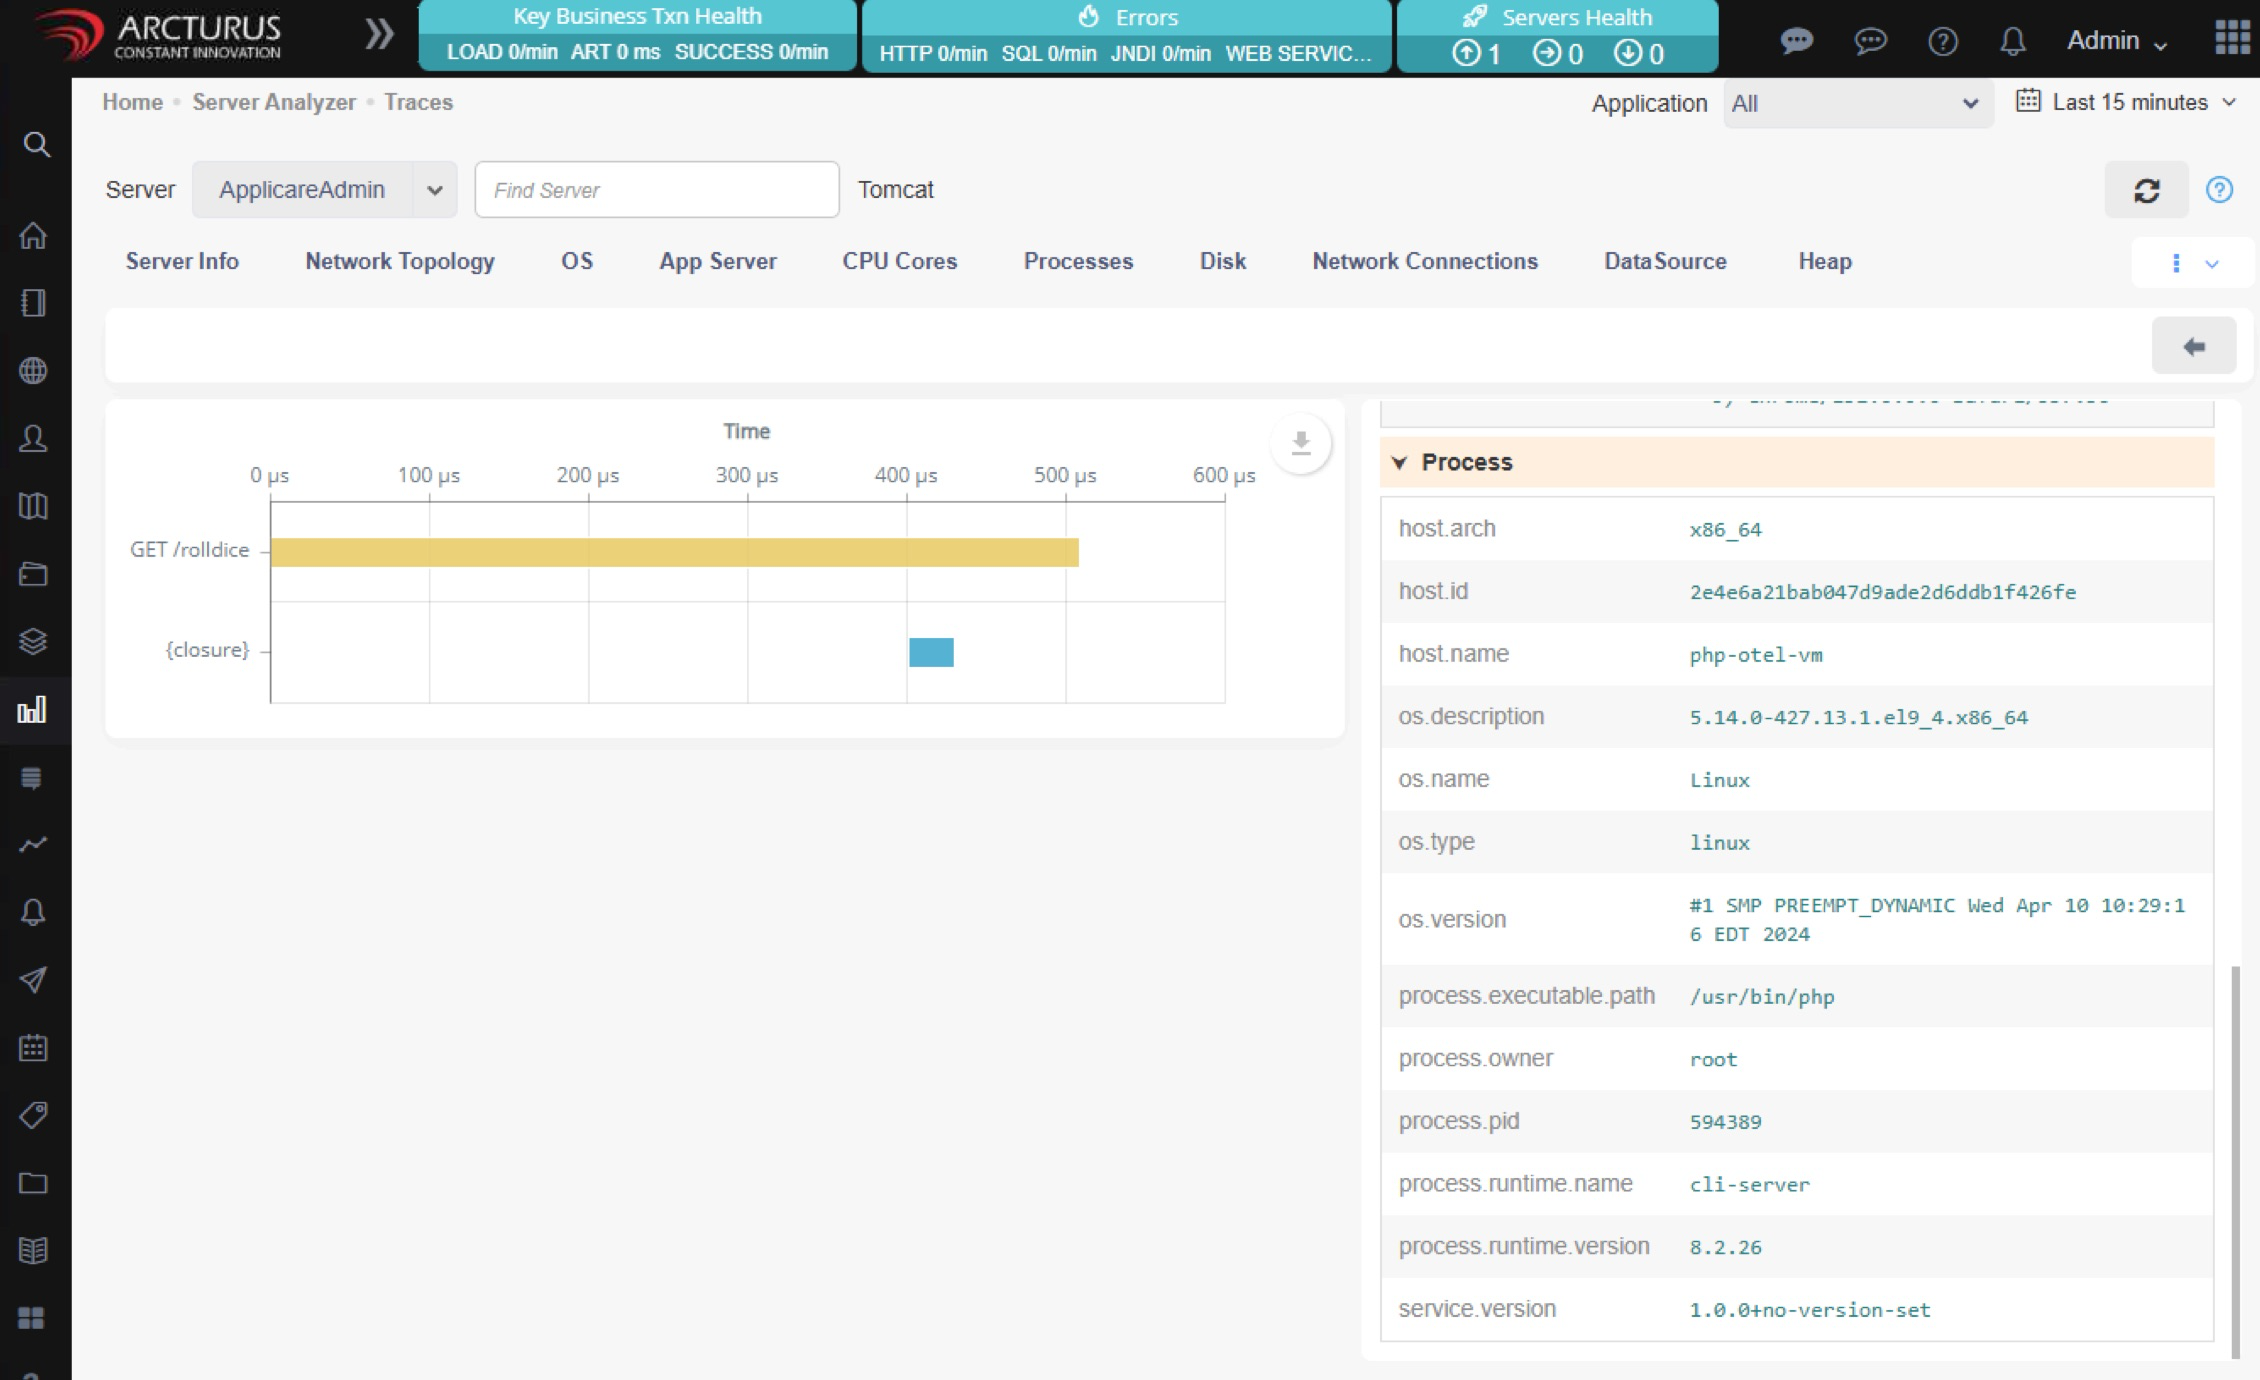
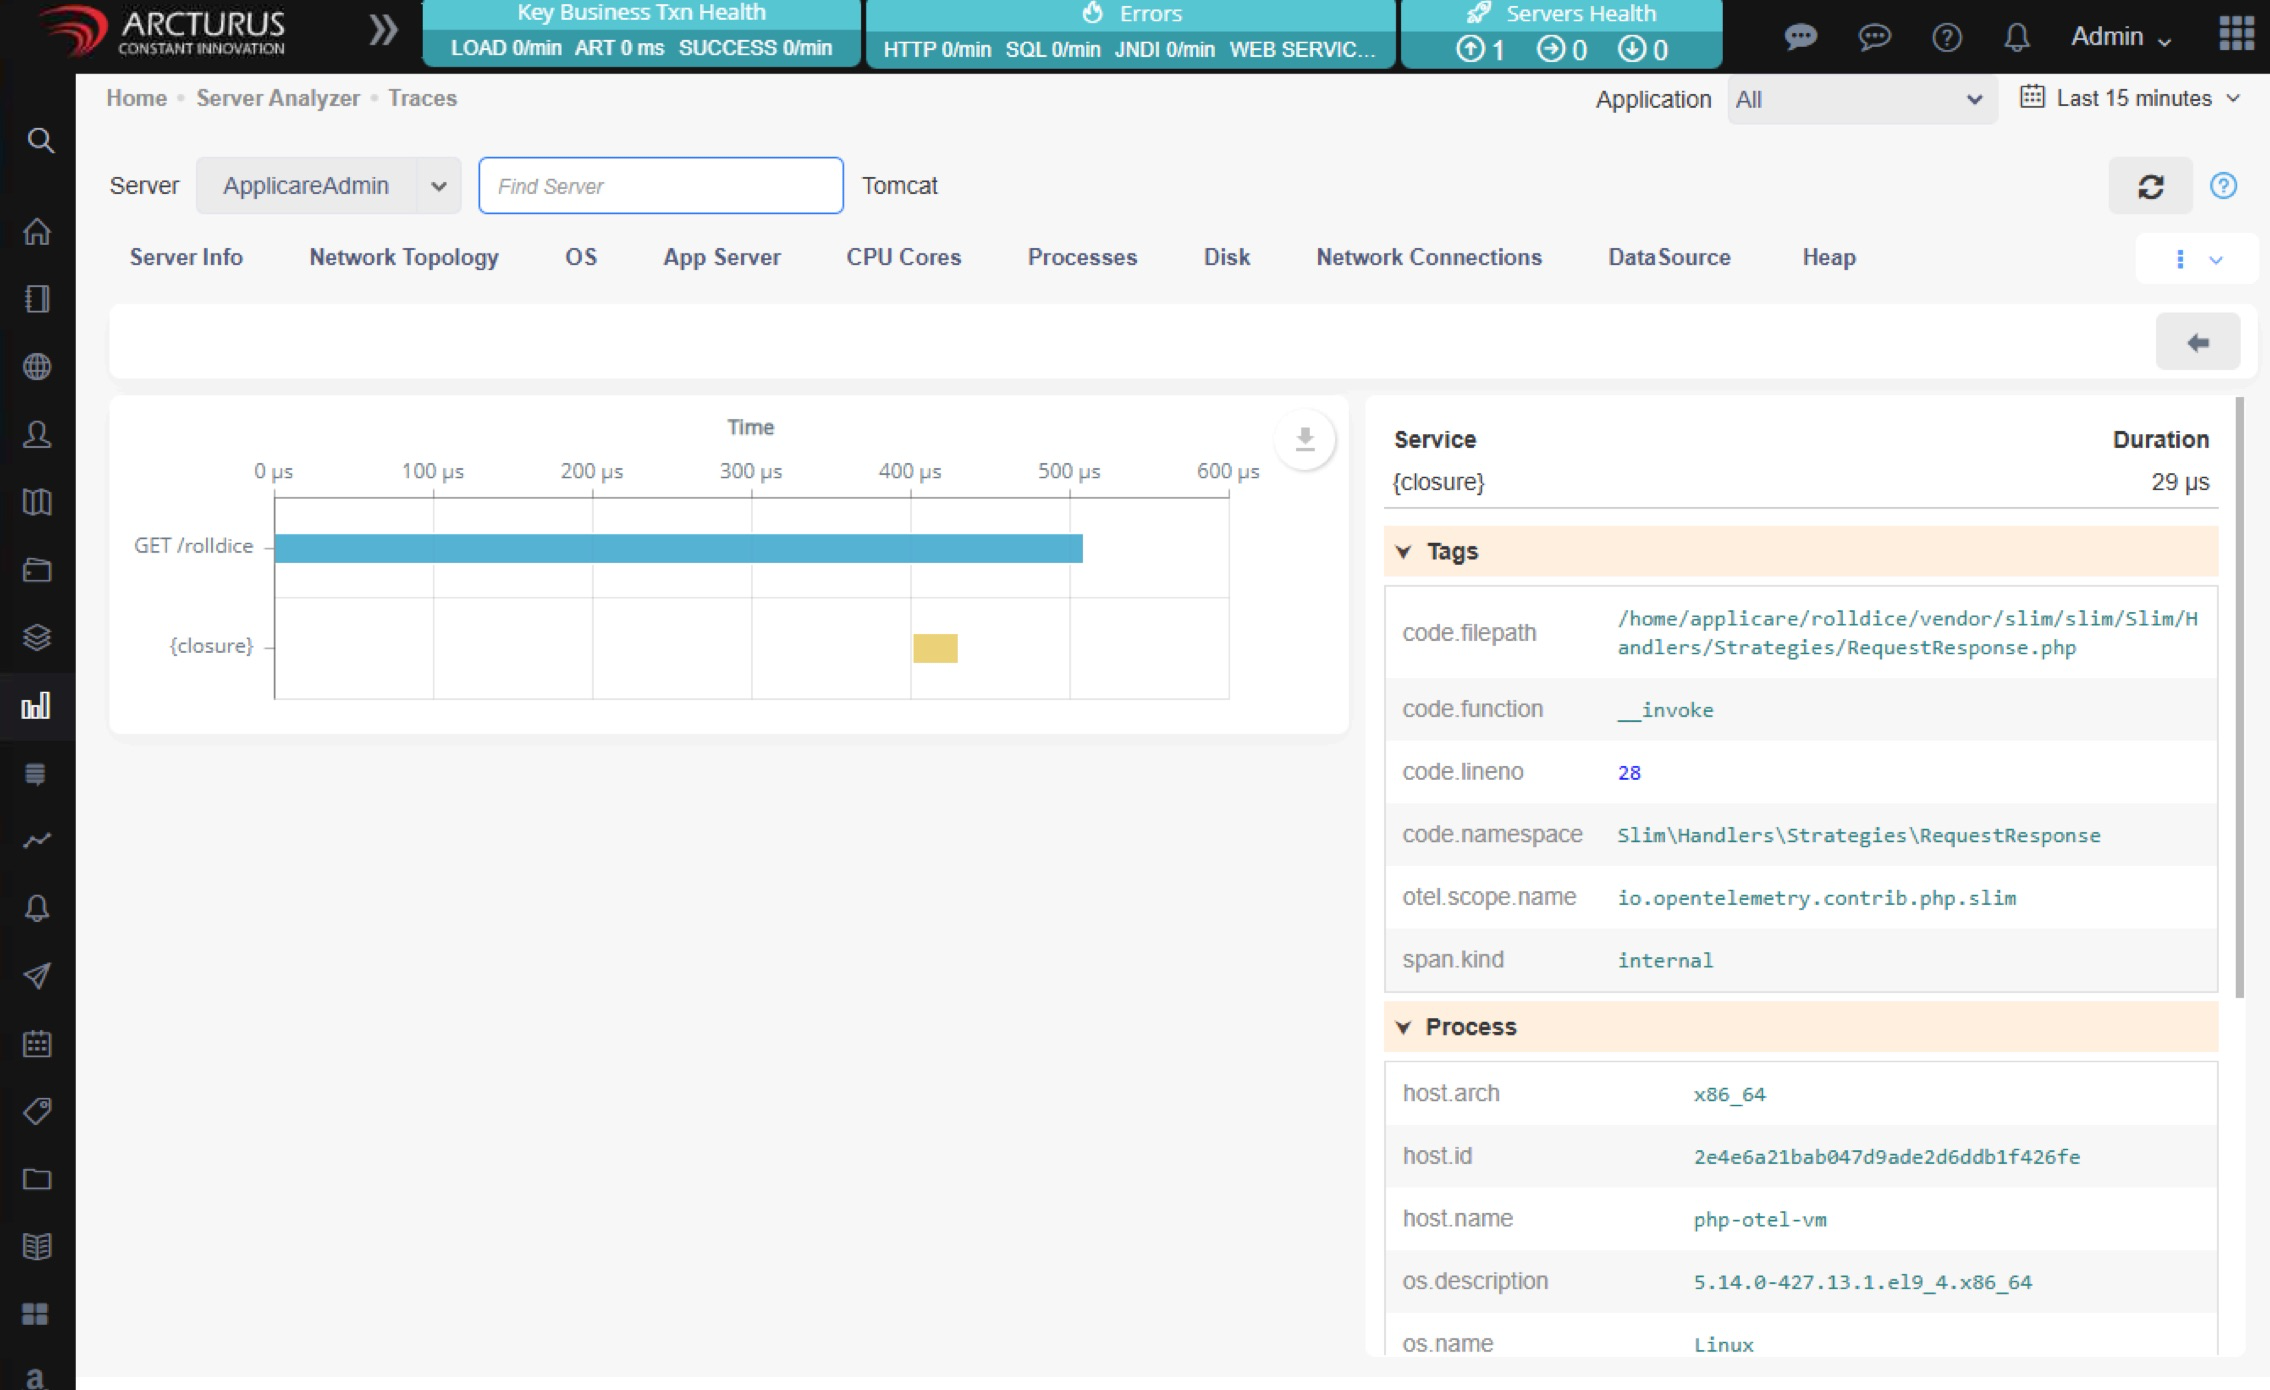
2. After clicking on any transaction, it will show the transaction trace details.

Screenshot 2 — PHP Application Monitoring

Screenshot 3 — PHP Application Monitoring

Screenshot 4 — PHP Application Monitoring

Configuration

Follow the configuration instructions provided in the link below to monitor your PHP application.

Configure PHP application

Was this article helpful?

Votes, comments and follows are kept by Zendesk, so they need a Help Center account. These buttons open this article there.

Opens Zendesk · needs internet and sign-in

Still stuck? Contact support