
The Operation center shows Average Performance Time (ART) of KBT performance based on applications. It displays from last 60 mins data and refreshes automatically every 5 mins.
Applications KBT transactions in last 60 minutes will not be displayed. At the bottom of the page grid, the grid shows alerts from the last 60 minutes for the Application listed in the KBT's ART grid at the top.
Configure criteria
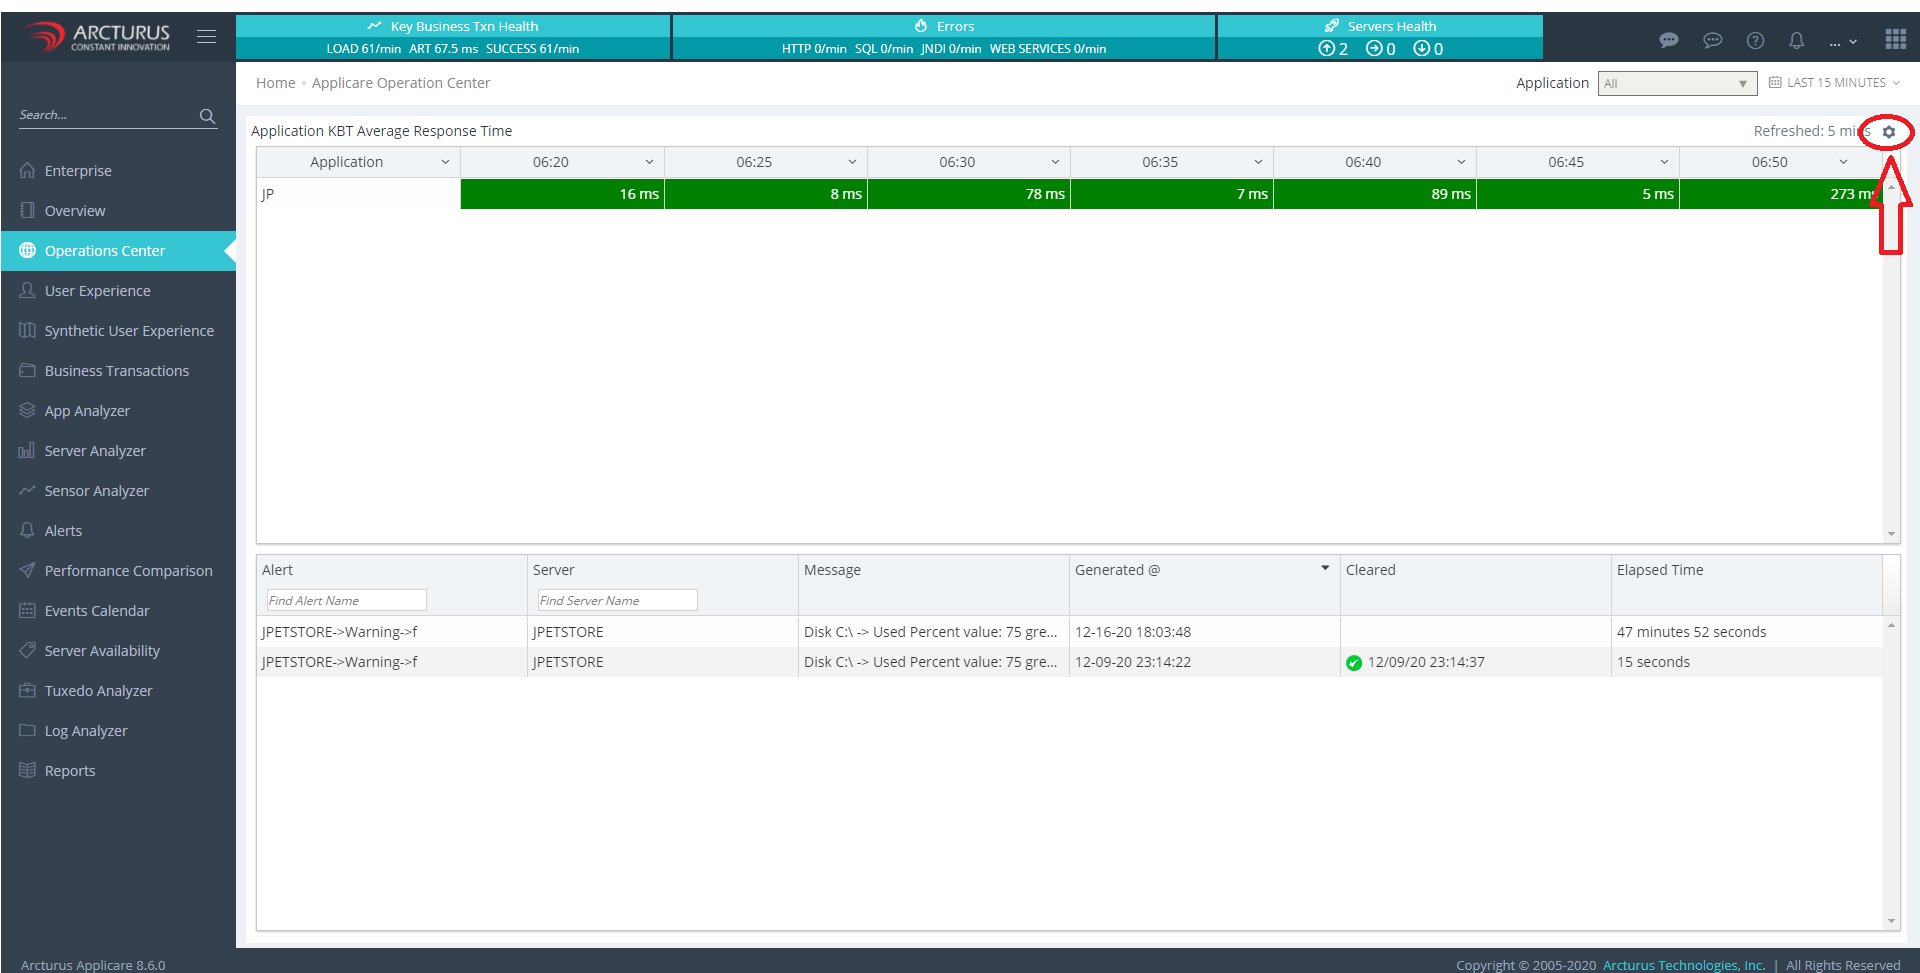 > [Screenshot 2 could not be downloaded during import — see migration report]
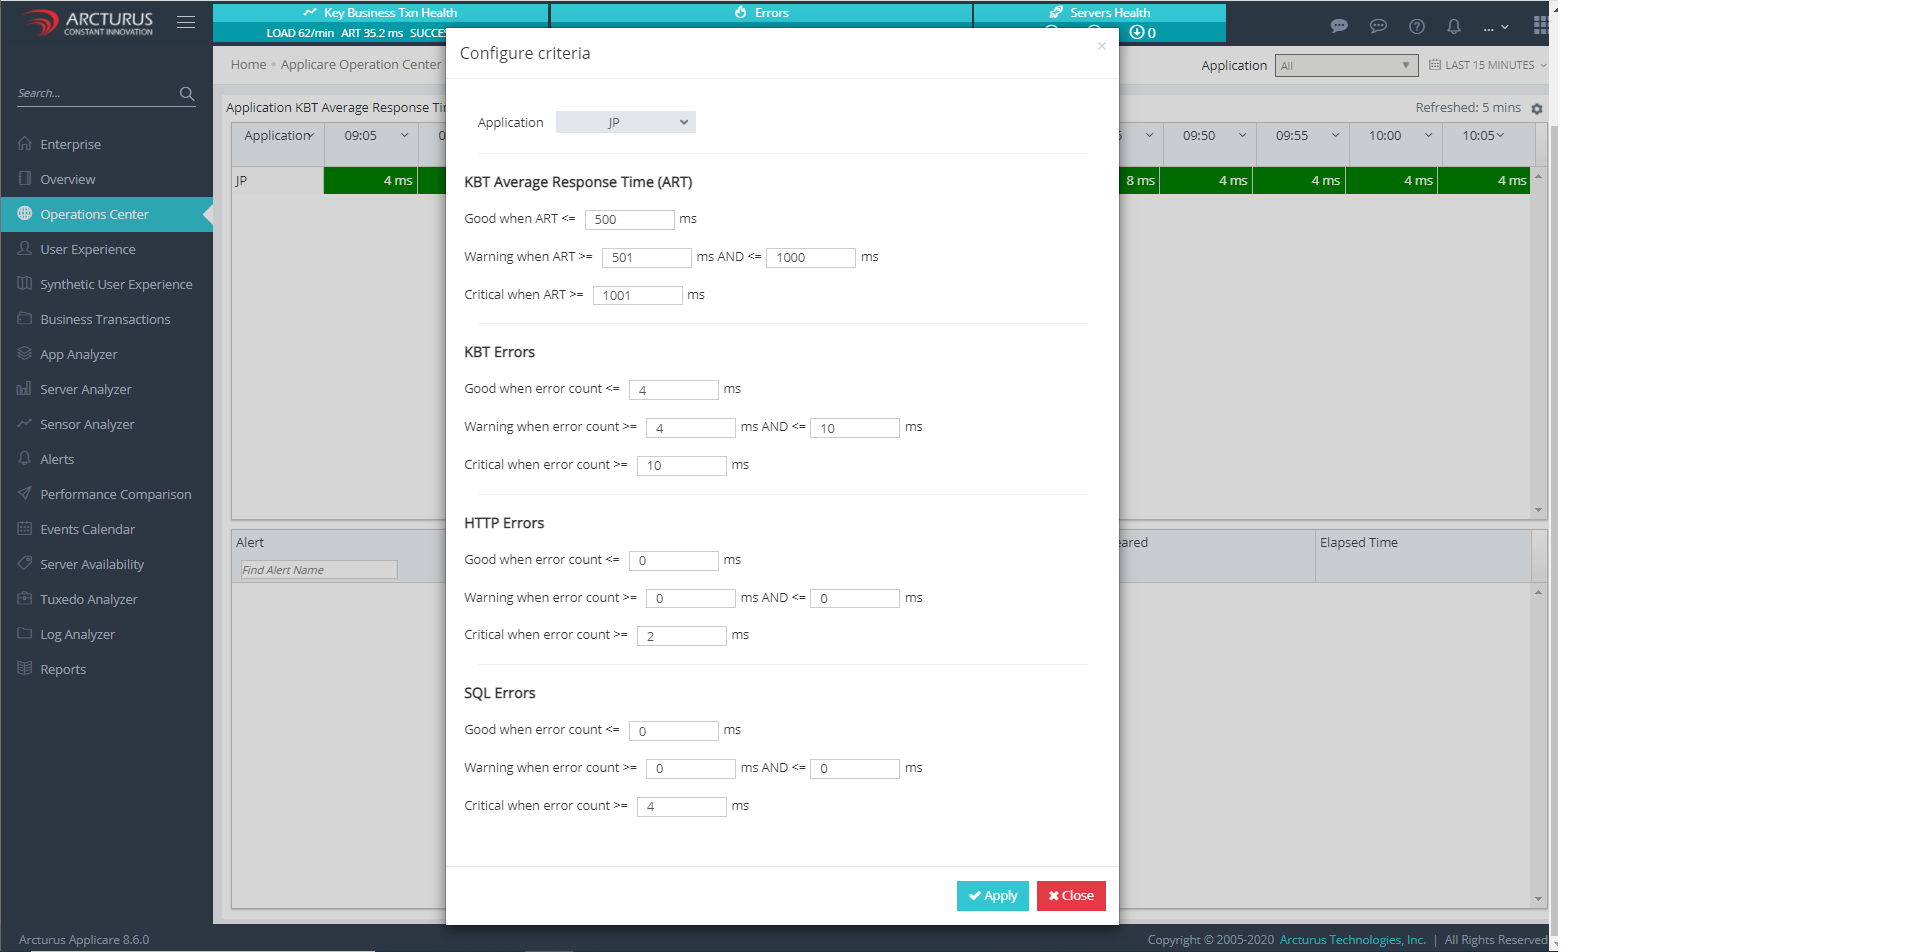
The "Configure Criteria" feature helps users easily differentiate between best, average, and worst performance using color coding. You can set color codes for KBT ART, KBT errors, HTTP errors, and SQL error counts. Values within the good range are shown in green, those in the warning range in yellow, and critical values in red.
You can configure KBT criteria for individual applications.
_[Screenshot 4 could not be downloaded during import — see migration report]_To view more details, hover your mouse over any color-coded cell in the KBT's ART grid and a tooltip will display the information.
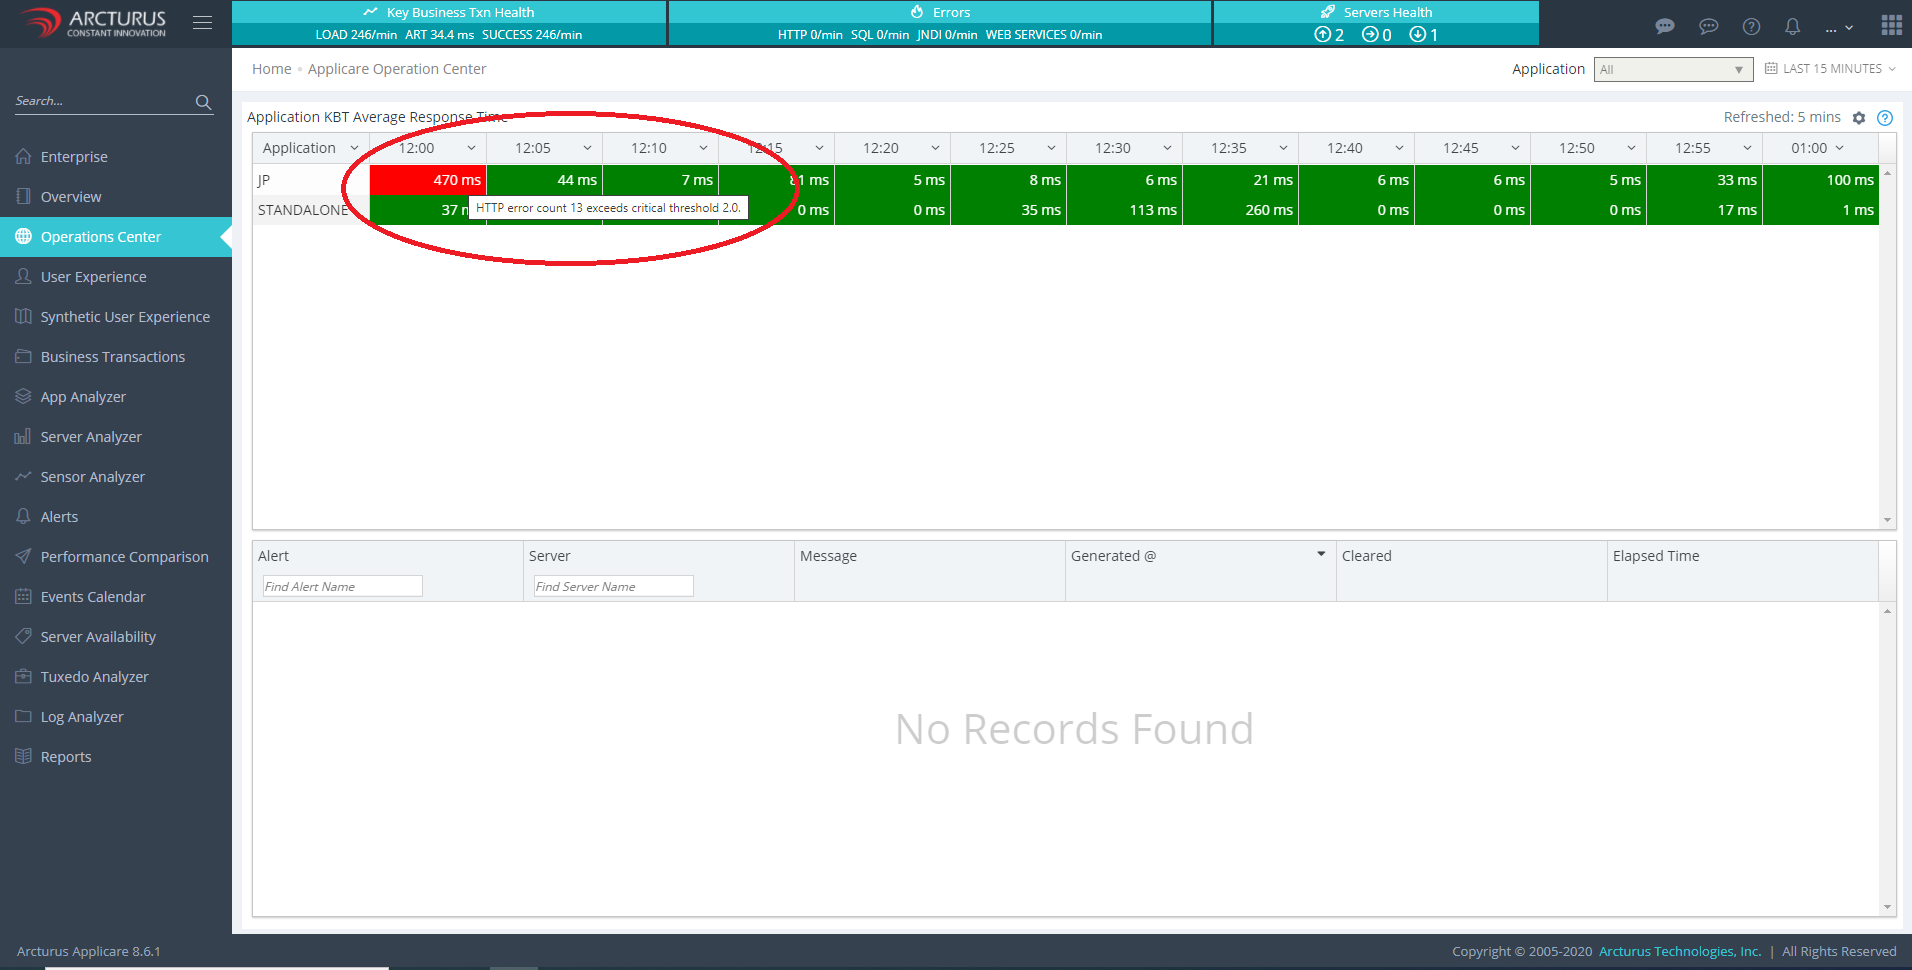
_[Screenshot 6 could not be downloaded during import — see migration report]_By default, Application with more critical state are displayed on the top and least one are displayed at the bottom (i.e Apps with more Red are displayed on the top and least Red are displayed at the bottom). It helps to easily identity the apps in trouble.