Access the Applicare controller and navigate to the Server Analyzer menu to view the details.
Dashboard
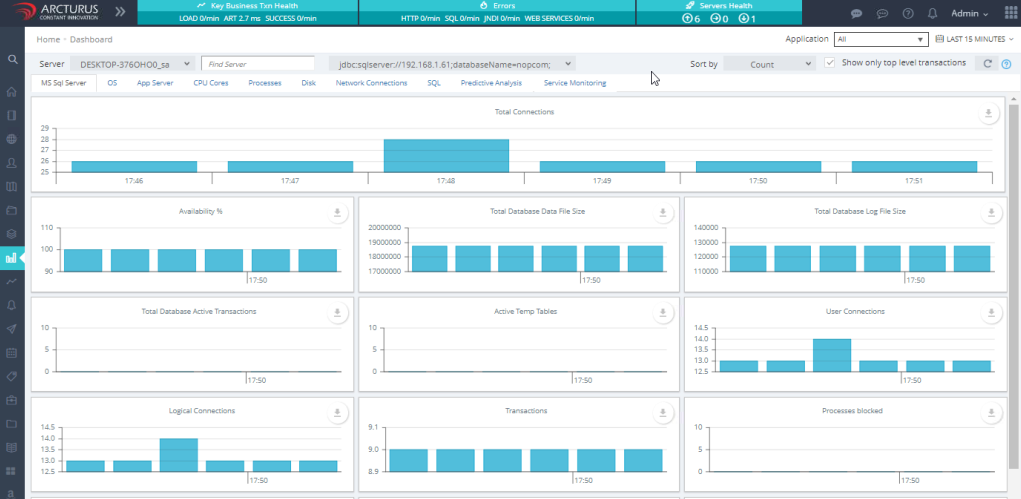
Database performance metrics help you monitor and improve the performance of your database. They cover the whole server, not just the specific database mentioned in the JDBC URL.
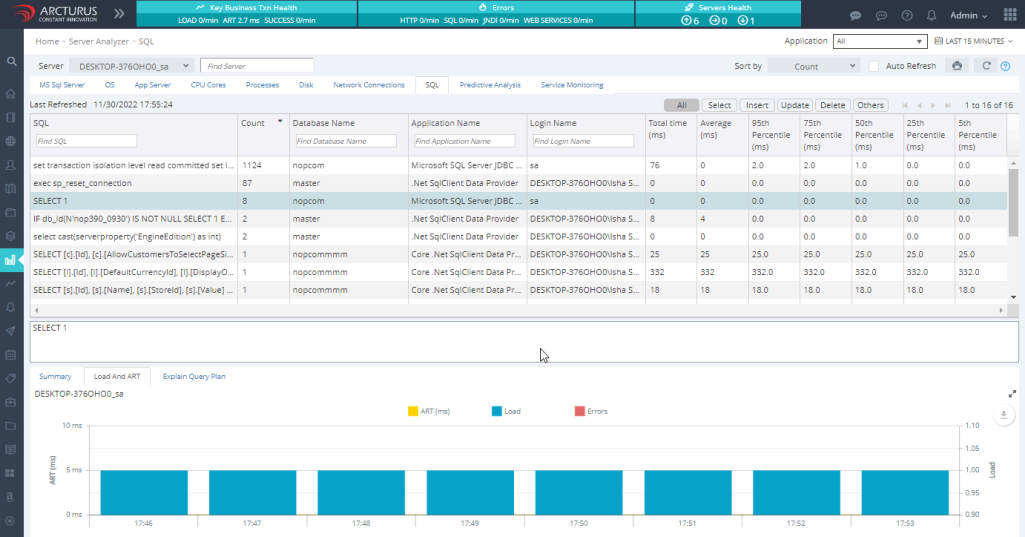
SQL
SQL Statement Profiling shows how well your database queries are performing. It helps you see which queries are slow and find out what’s causing performance problems. You’ll get details like the number of queries, their average time, and other useful stats.
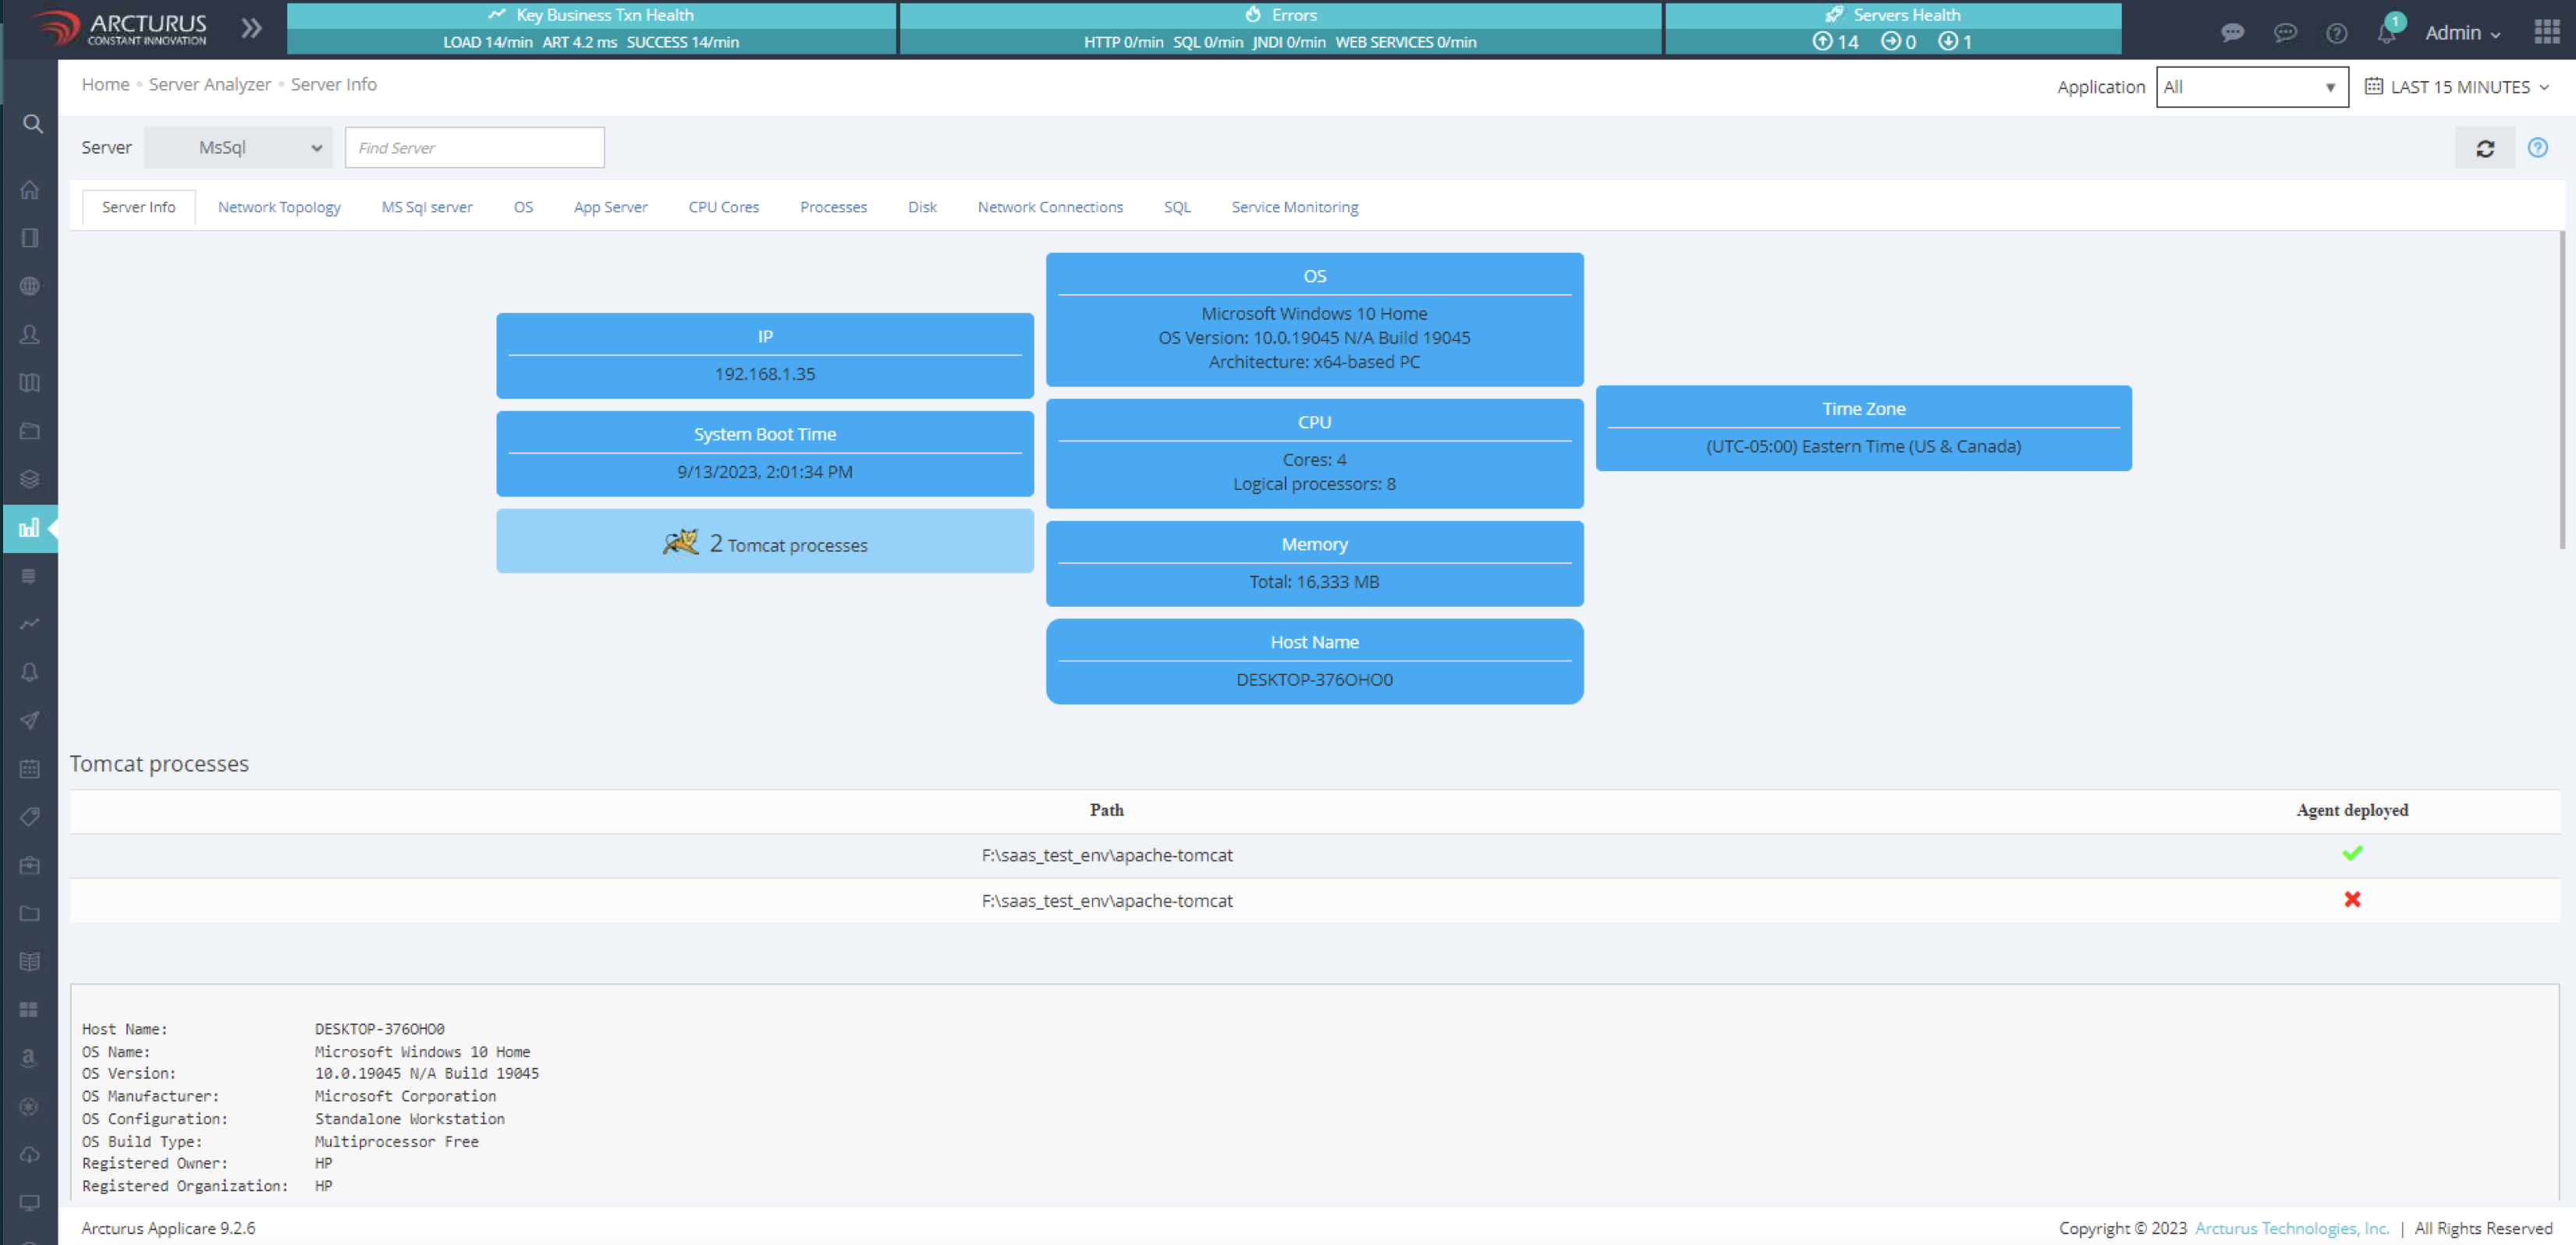
Server Info
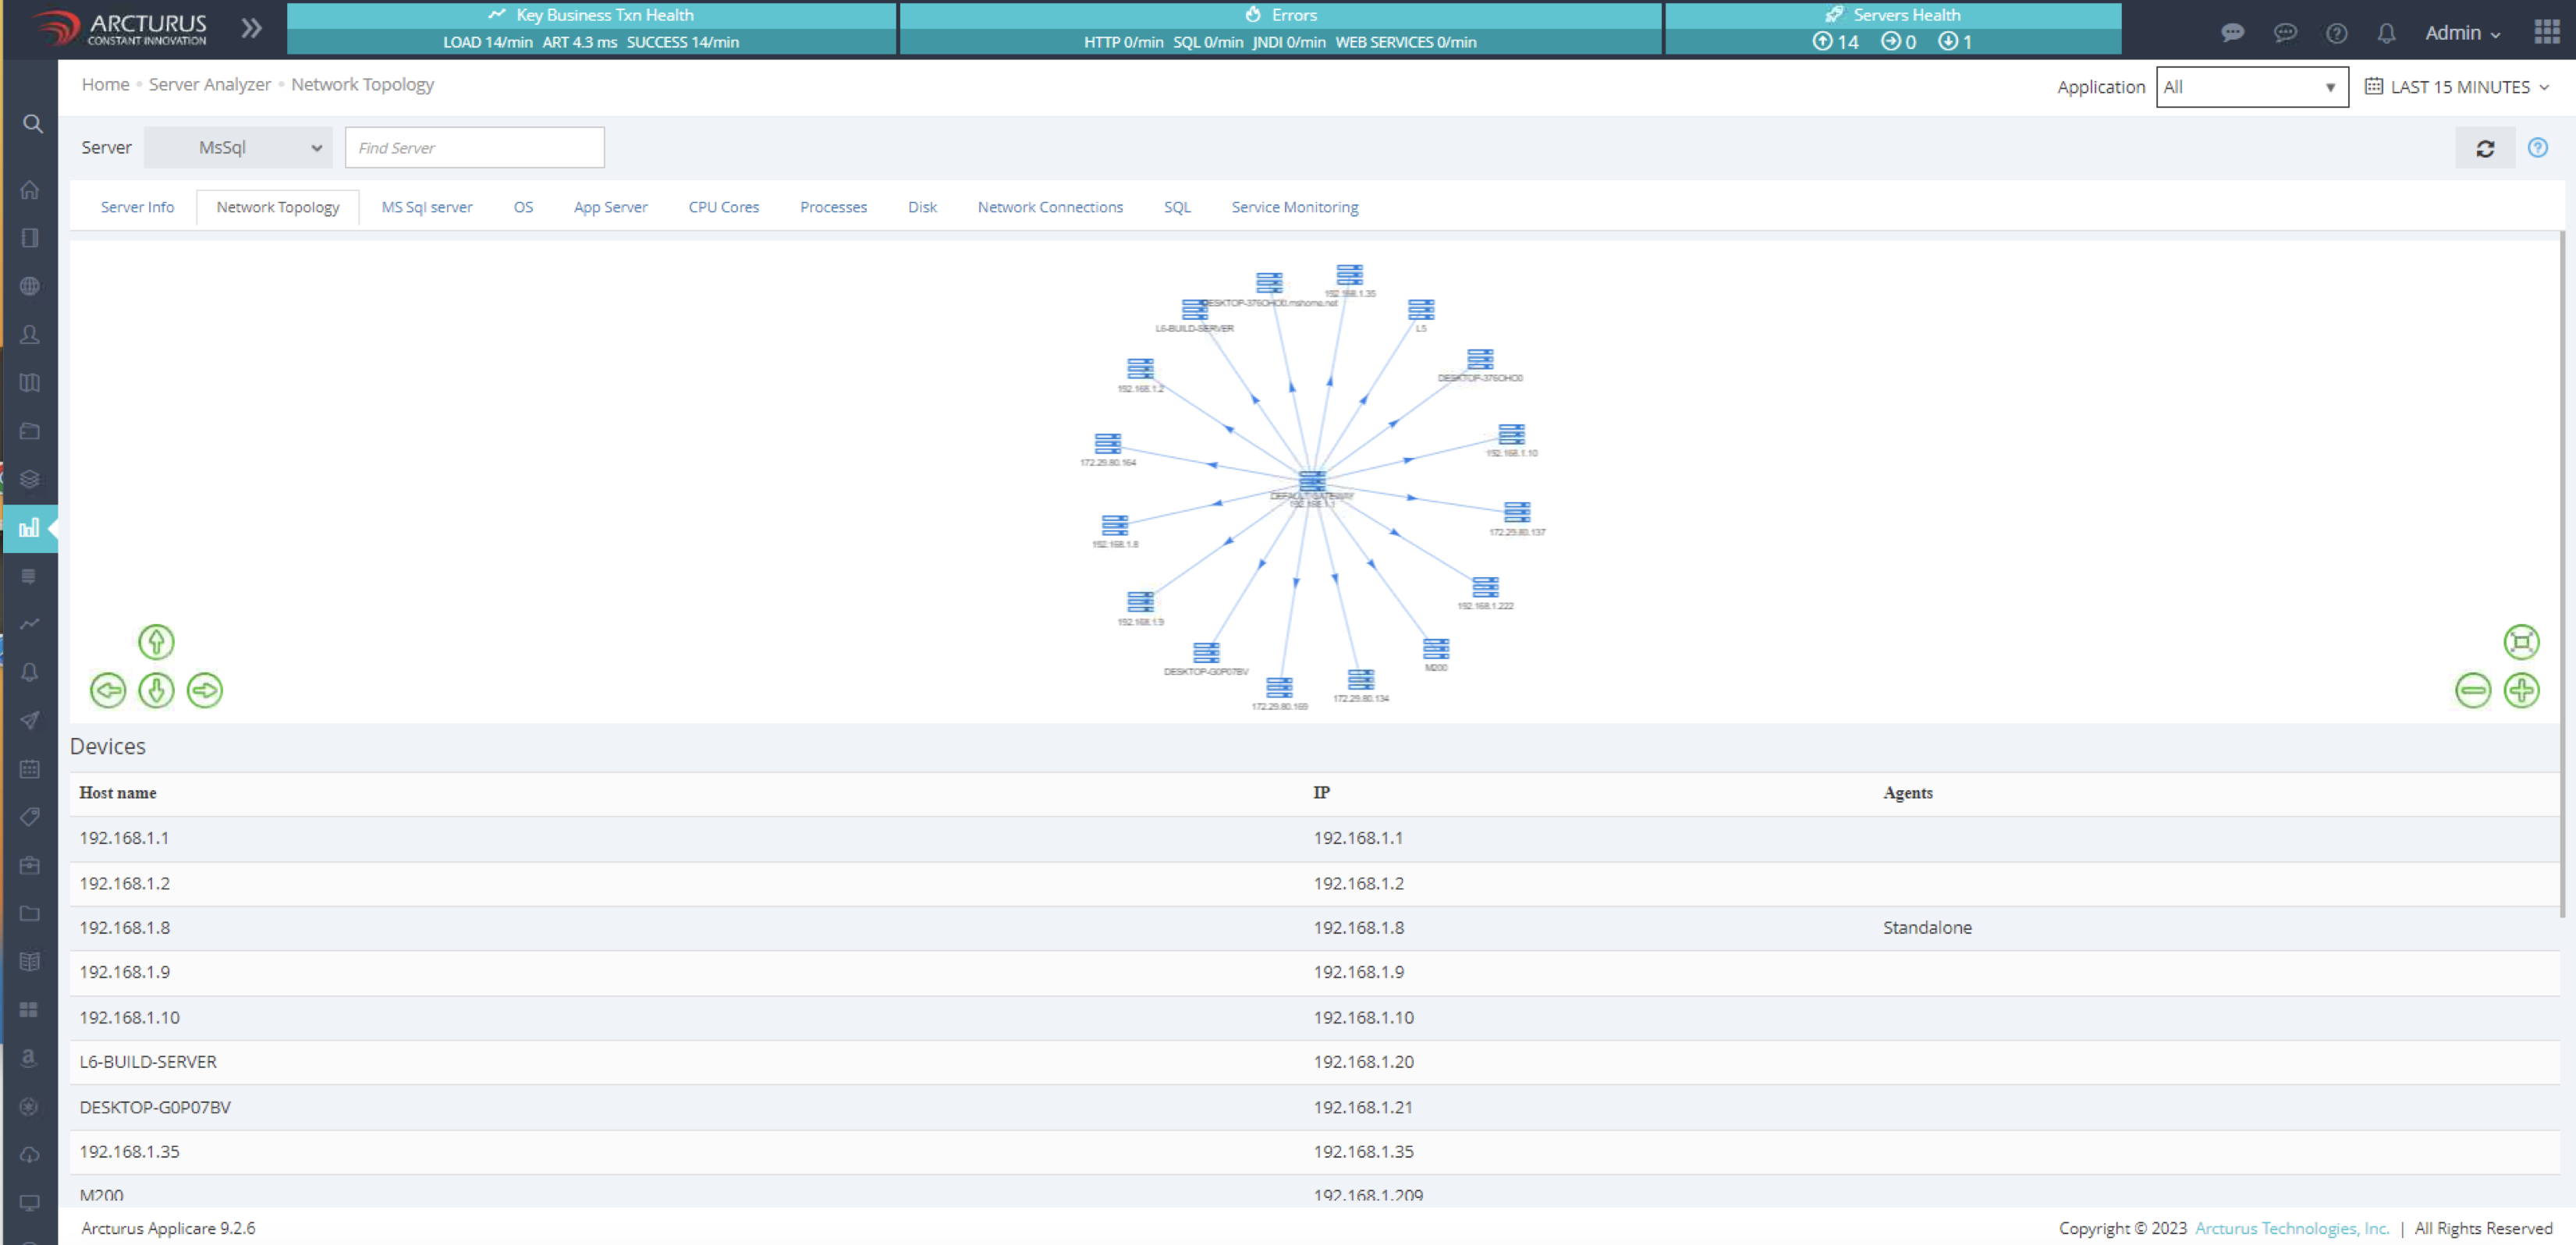
Network Topology
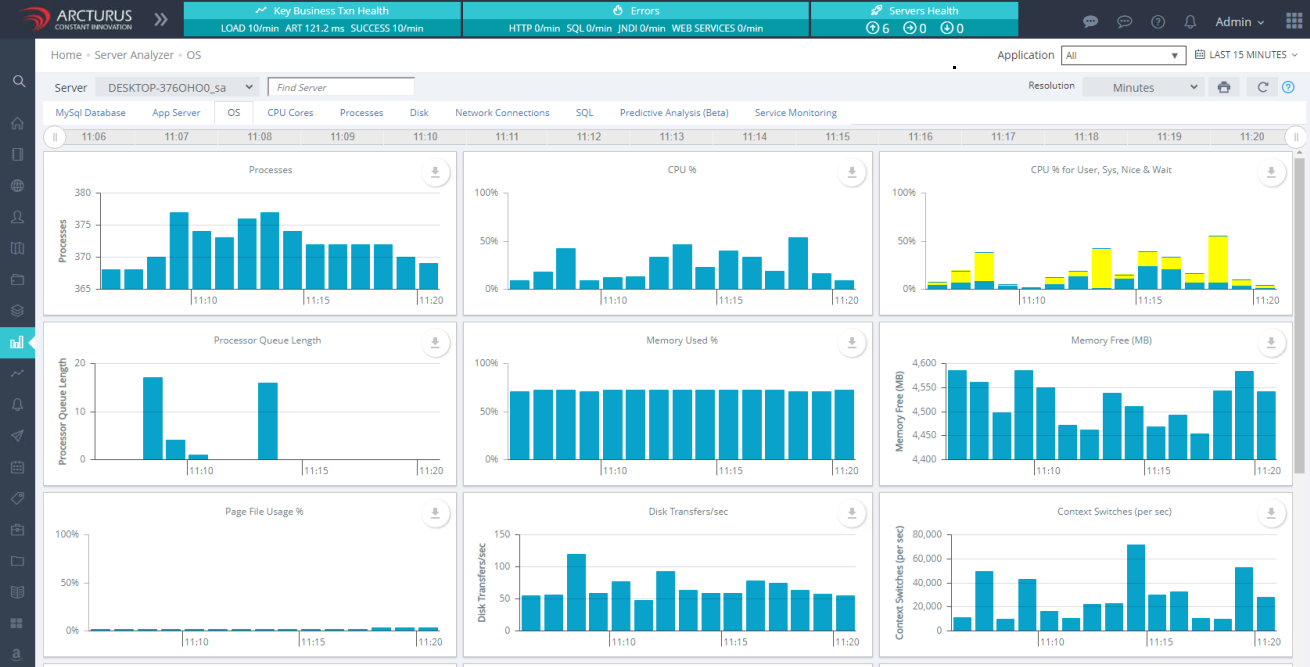
OS
This view offers a quick and easy overview of your physical server's or VM's performance, including details on processes, context switches, CPU usage, memory, and storage performance..
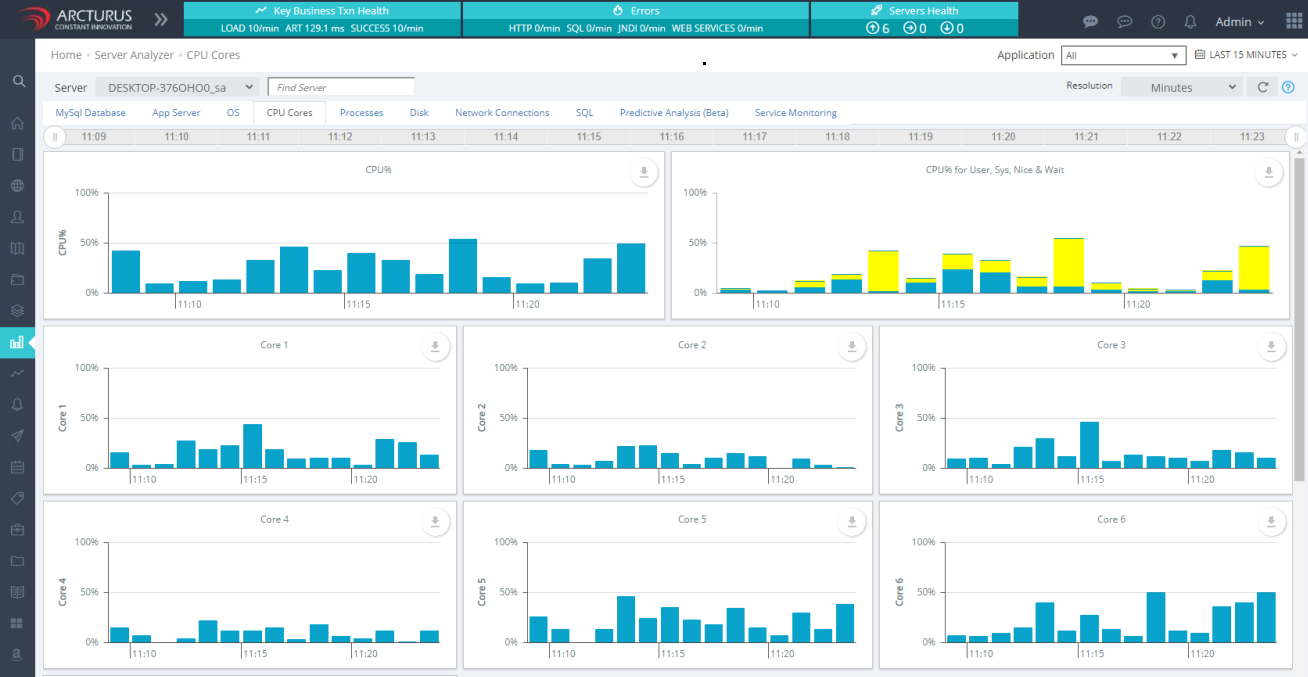
CPU CORE Analyzer
This view offers a comprehensive overview of the CPU including details information about each individual CPU core.
Processes
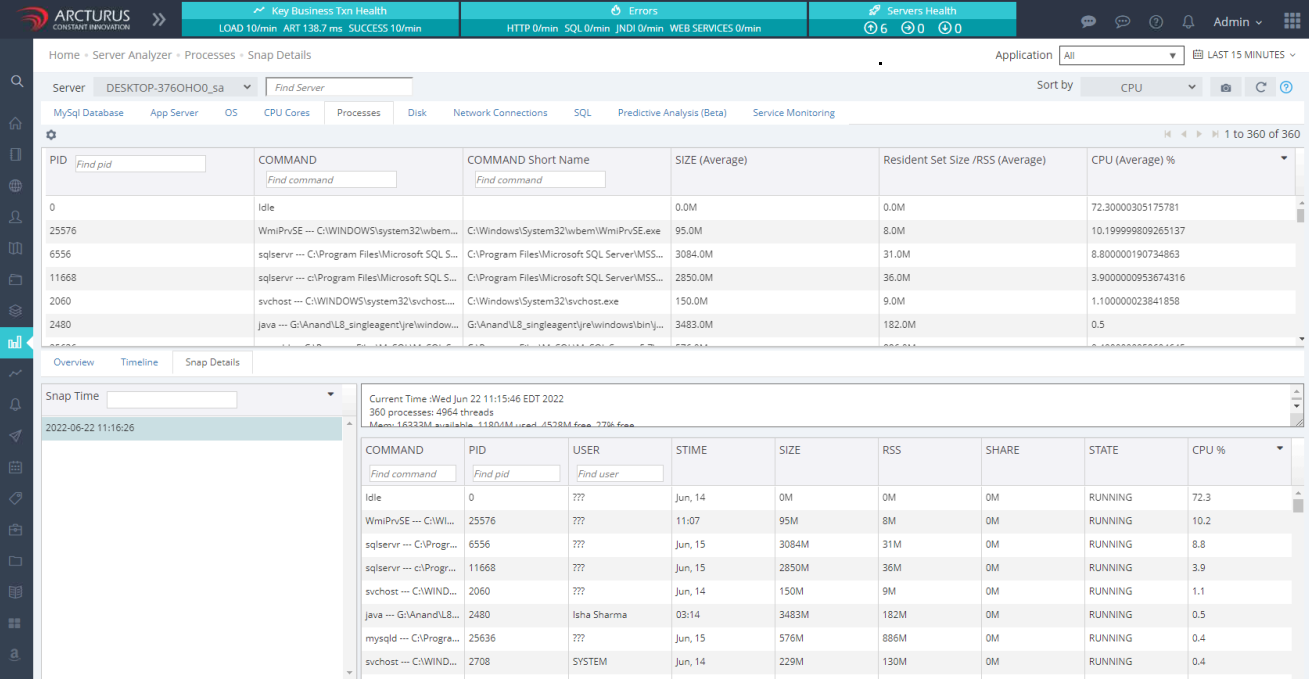
This view offers organized performance stats for the CPU, memory and running processes.
It includes historical snapshots of processes showing resource usage at various points in time. by default, Applicare takes a snapshot every 10 minutes but this interval can be adjusted according to your needs.
Disk
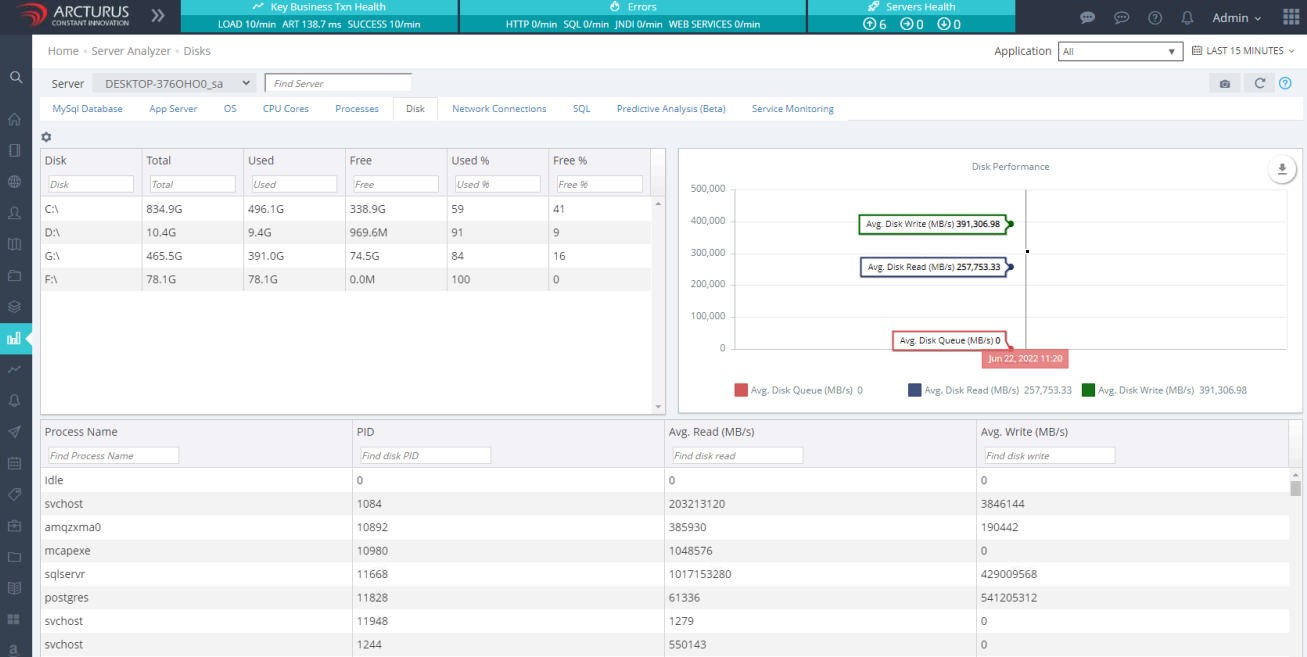
This view provides the disk usage accessed by each and every process.
Network Connections
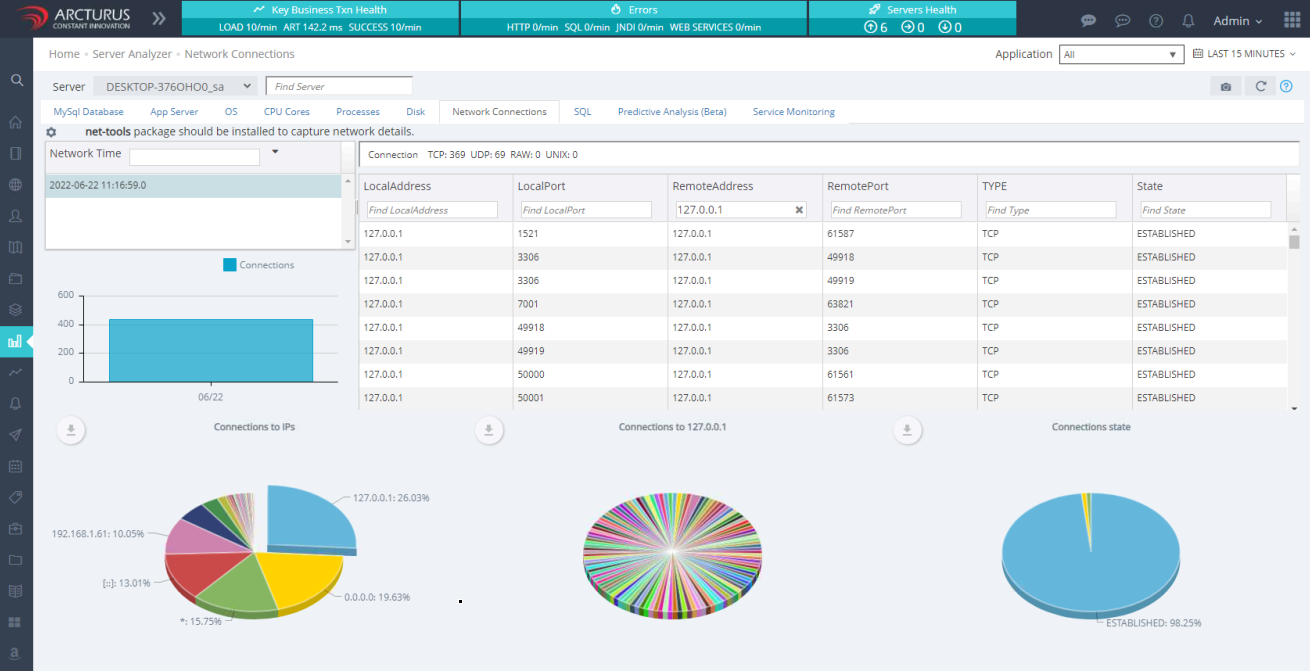
This view provides the TCP, UDP, RAW, and UNIX connection Details.
SQL Report
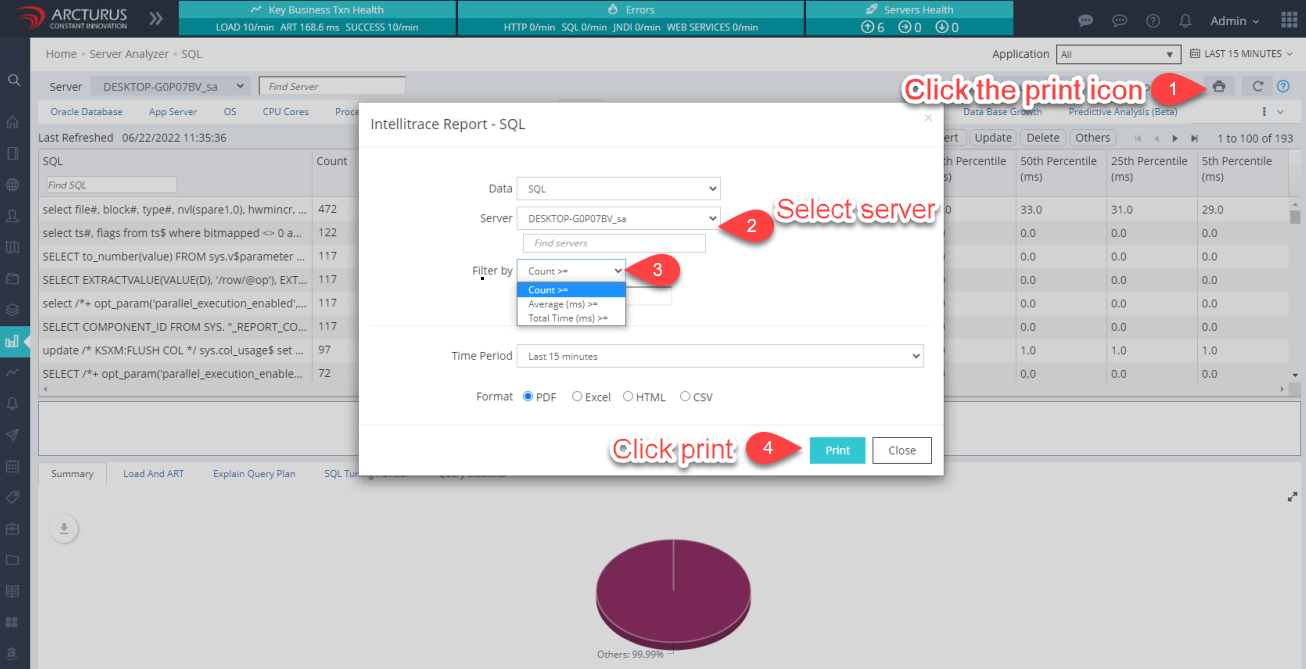
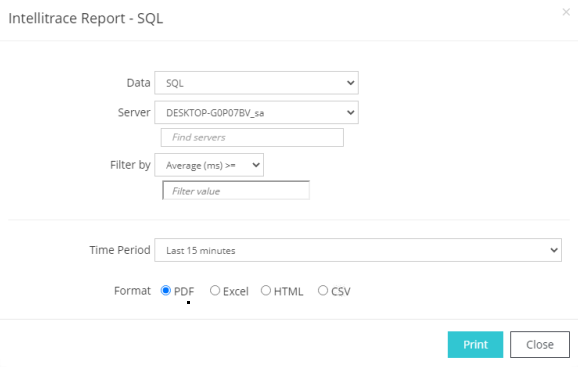
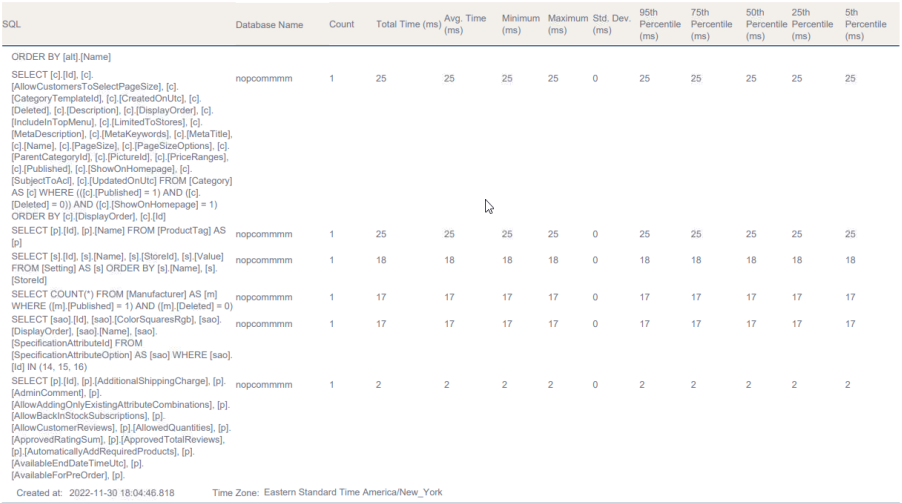
The SQL statements can be downloaded as a report by clicking the print icon from the Server Analyzer menu SQL Screen.