Updated Sep 13, 2024Applies to 10.0, 9.2Not yet checked for Applicare 10.0
Check this against your version
This article was last updated on Sep 13, 2024, before Applicare 10.0 was released (Jun 19, 2026), and has not been re-checked for Applicare 10.0. Confirm the steps in your environment or contact Support.
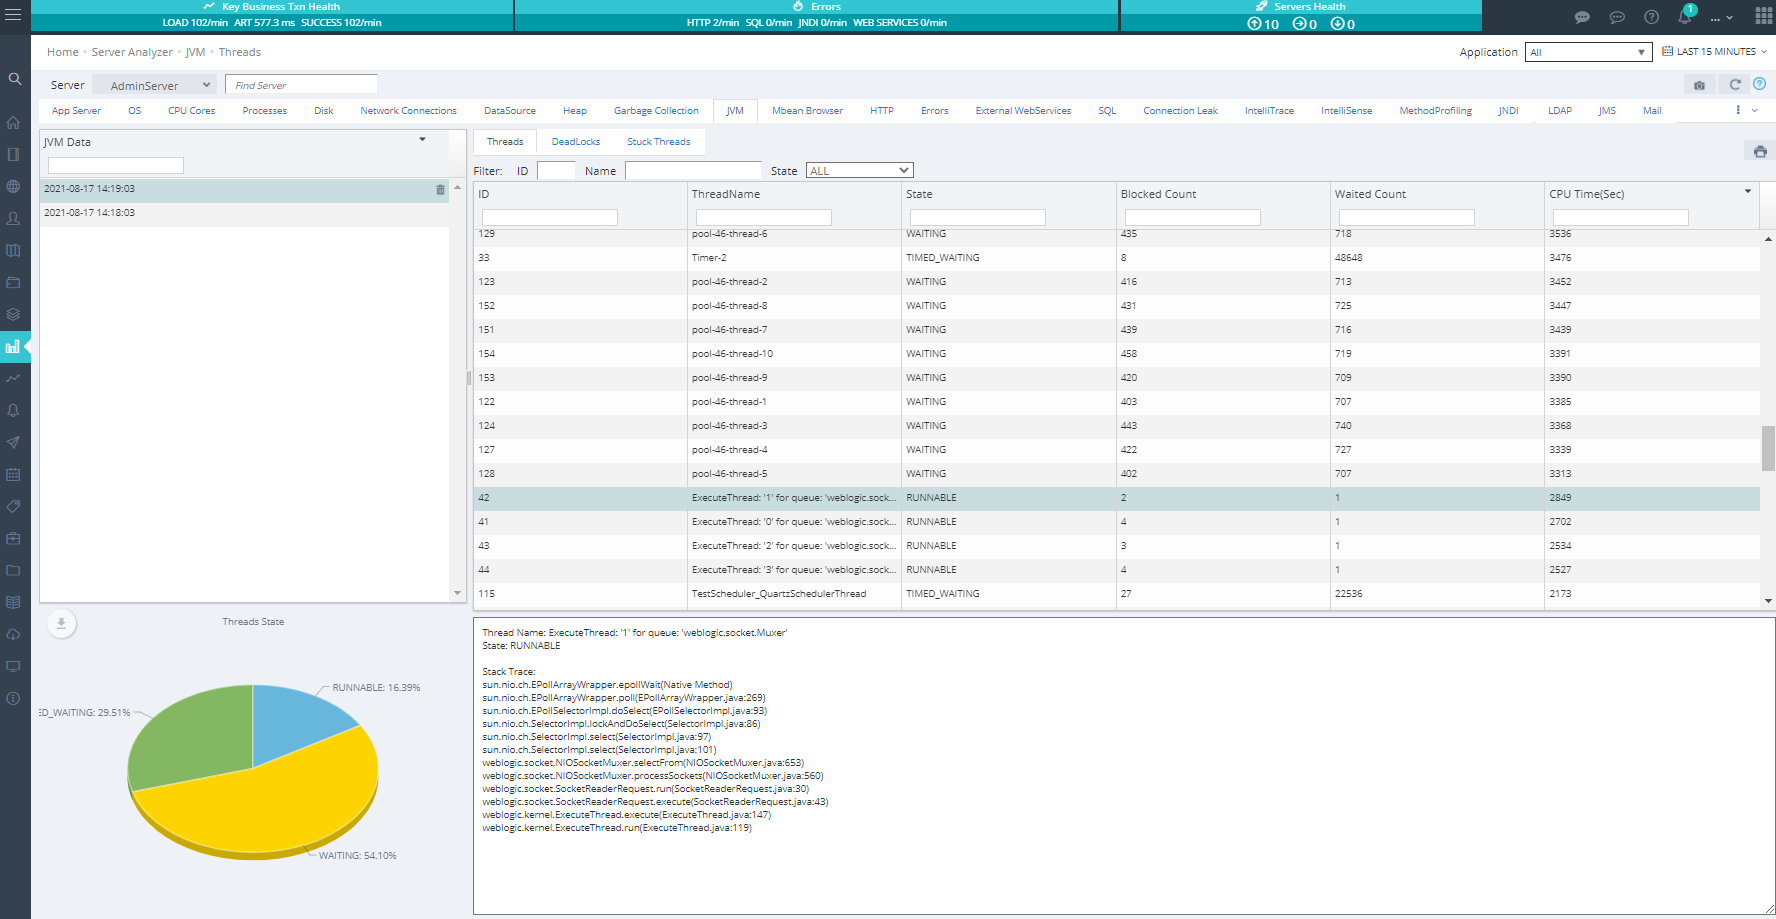
This view enables you to capture a thread dump of a live server, which you can analyze the saved later. The saved snapshots include all the thread details visible in the real-time view and as well as any deadlock or stuck threads detected when the dump was created.